Глобальные климатические изменения очень сложны, поэтому современная наука не может дать однозначного ответа, что же нас ожидает в ближайшем будущем. Существует множество сценариев развития ситуации.
Сценарий 1 – глобальное потепление будет происходить постепенно
Земля очень большая и сложная система, состоящая из большого количества связанных между собой структурных компонентов. На планете есть подвижная атмосфера, движение воздушных масс которой распределяет тепловую энергию по широтам планеты, на Земле есть огромный аккумулятор тепла и газов – Мировой океан (океан накапливает в 1000 раз больше тепла, чем атмосфера) Изменения в такой сложной системе не могут происходить быстро. Пройдут столетия и тысячелетия, прежде чем можно будет судить об сколько-нибудь ощутимом изменении климата.
Сценарий 2 – глобальное потепление будет происходить относительно быстро
Самый «популярный» в настоящее время сценарий. По различным оценкам за последние сто лет средняя температура на нашей планете увеличилась на 0,5-1°С, концентрация — СО2 возросла на 20-24 %, а метана на 100%. В будущем эти процессы получат дальнейшее продолжение и к концу XXI века средняя температура поверхности Земли может увеличиться от 1,1 до 6,4°С, по сравнению с 1990 годом (по прогнозам IPCC от 1,4 до 5,8°С). Дальнейшее таяние Арктических и Антарктических льдов может ускорить процессы глобального потепления из-за изменения альбедо планеты. По утверждению некоторых учёных, только ледяные шапки планеты за счёт отражения солнечного излучения охлаждают нашу Землю на 2°С, а покрывающий поверхность океана лёд существенно замедляет процессы теплообмена между относительно теплыми океаническим водами и более холодным поверхностным слоем атмосферы. Кроме того, над ледяными шапками практически нет главного парникового газа – водяного пара, так как он выморожен.
Глобальное потепление будет сопровождаться подъёмом уровня мирового океана. С 1995 по 2005 год уровень Мирового океана уже поднялся на 4 см, вместо прогнозируемых 2-ух см. Если уровень Мирового океана в дальнейшем будет подниматься с такой же скоростью, то к концу XXI века суммарный подъём его уровня составит 30 — 50 см, что вызовет частичное затопление многих прибрежных территорий, особенно многонаселённого побережья Азии. Следует помнить, что около 100 миллионов человек на Земле живёт на высоте меньше 88 сантиметров над уровнем моря. Кроме повышения уровня Мирового океана глобальное потепление влияет на силу ветров и распределение осадков на планете. В результате на планете вырастет частота и масштабы различных природных катаклизмов (штормы, ураганы, засухи, наводнения).
В настоящее время от засухи страдает 2% всей суши, по прогнозам некоторых учёных к 2050 году засухой будет охвачено до 10% всех земель материков. Кроме того, изменится распределение количества осадков по сезонам.
Сценарий 3 – Глобальное потепление в некоторых частях Земли сменится кратковременным похолоданием
Известно, что одним из факторов возникновения океанических течений является градиент (разница) температур между арктическими и тропическими водами. Таяние полярных льдов способствует повышению температуры Арктических вод, а значит, вызывает уменьшение температурной разницы между тропическими и арктическими водами, что не минуемо, в будущем приведёт к замедлению течений.
Одним из самых известных тёплых течений является Гольфстрим, благодаря которому во многих странах Северной Европы среднегодовая температура на 10 градусов выше, чем в других аналогичных климатических зонах Земли. Понятно, что остановка этого океанического конвейера тепла очень сильно повлияет на климат Земли. Уже сейчас течение Гольфстрим, стало слабее на 30% по сравнению с 1957 годом. Математическое моделирование показало, чтобы полностью остановить Гольфстрим достаточно будет повышения температуры на 2-2,5 градуса. В настоящее время температура Северной Атлантики уже прогрелась на 0,2 градуса по сравнению с 70-ми годами. В случае остановки Гольфстрима среднегодовая температура в Европе к 2010 году понизится на 1 градус, а после 2010 года дальнейший рост среднегодовой температуры продолжится. Другие математические модели «сулят» более сильное похолодание Европе.
Согласно этим математическим расчётам полная остановка Гольфстрима произойдёт через 20 лет, в результате чего климат Северной Европы, Ирландии, Исландии и Великобритании может стать холоднее настоящего на 4-6 градусов, усилятся дожди и участятся шторма. Похолодание затронет также и Нидерланды, Бельгию, Скандинавию и север европейской части России. После 2020-2030 года потепление в Европе возобновится по сценарию №2.
Сценарий 4 – Глобальное потепление сменится глобальным похолоданием
Остановка Гольфстрима и других океанических вызовет глобальное потепление на Земле и наступление очередного ледникового периода.
Сценарий 5 — Парниковая катастрофа
Парниковая катастрофа — самый «неприятный» сценарий развития процессов глобального потепления. Автором теории является наш учёный А.В. Карнаухов, суть её в следующем. Рост среднегодовой температуры на Земле, вследствие увеличения в атмосфере Земли содержания антропогенного CO2, вызовет переход в атмосферу растворённого в океане CO2, а также спровоцирует разложение осадочных карбонатных пород с дополнительным выделением углекислого газа, который, в свою очередь, поднимет температуру на Земле ещё выше, что повлечёт за собой дальнейшее разложение карбонатов, лежащих в более глубоких слоях земной коры (в океане содержится углекислого газа в 60 раз больше, чем в атмосфере, а в земной коре почти в 50 000 раз больше). Ледники будут интенсивно таять, уменьшая альбедо Земли. Такое быстрое повышение температуры будет способствовать интенсивному поступлению метана из тающей вечной мерзлоты, а повышение температуры до 1,4–5,8°С к концу столетия будет способствовать разложению метангидратов (льдистых соединений воды и метана), сосредоточенных преимущественно в холодных местах Земли.
Если учесть, что метан, является в 21 раз более сильным парниковым газом, чем CO2 рост температуры на Земле будет катастрофическим. Чтобы лучше представить, что будет с Землёй лучше всего обратить внимание на нашего соседа по солнечной системе – планету Венера. При таких же параметрах атмосферы, как на Земле, температура на Венере должна быть выше Земной всего на 60°С (Венера ближе Земли к Солнцу) т.е. быть в районе 75°С, в реальности же температура на Венере почти 500°С. Большинство карбонатных и метано-содержащих соединений на Венере давным давно были разрушены с выделением углекислого газа и метана. В настоящее время атмосфера Венеры состоит на 98% из СО2, что приводит к увеличению температуры планеты почти на 400°С.
Если глобальное потепление пойдёт по такому же сценарию, как на Венере, то температура приземных слоев атмосферы на Земле может достигнуть 150 градусов. Повышение температуры Земли даже на 50°С поставит крест, на человеческой цивилизации, а увеличение температуры на 150°С вызовет гибель почти всех живых организмов планеты.
По оптимистическому сценарию Карнаухова, если количество, поступающего в атмосферу CO2, останется на прежнем уровне, то температура 50°С, на Земле установится через 300 лет, а 150°С через 6000 лет. К сожалению, прогресс не остановить, с каждым годом объёмы выбросов CO2 только растут. По реалистическому сценарию, согласно которому выброс CO2 будет расти с такой же скоростью, удваиваясь каждые 50 лет, температура 50°С на Земле уже установится через 100 лет, а 150°С через 300 лет.
Екатерина Александрова
Что сулит нам глобальное потепление?
PNAS: ИИ спрогнозировал неизбежность нарушения Парижского соглашения к середине века
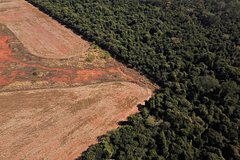
Фото: Amanda Perobelli / Reuters
Глобальная температура может преодолеть порог повышения на 1,5 градуса Цельсия, установленный Парижским соглашением в 2015 году, в ближайшие несколько десятилетий, даже если антропогенные выбросы углерода значительно сократятся. К такому выводу пришли ученые Стэнфордского университета и Университета штата Колорадо, которые опубликовали статью в журнале Proceedings of the National Academy of Sciences (PNAS).
Исследователи использовали методы машинного обучения, чтобы спрогнозировать увеличение глобальной температуры из-за выбросов парниковых газов, основываясь на исторических записях. Результаты моделирования подтвердили, что глобальное потепление уже приблизилось к порогу в 1,5 градуса Цельсия выше доиндустриального уровня. Его пересечение к середине века является неизбежным, даже если в ближайшем будущем воздействие антропогенных выбросов на климат существенно сократится.
Согласно прогнозу искусственного интеллекта (ИИ), порог, установленный Парижским соглашением, будет преодолен в период с 2033 по 2035 год в промежуточном сценарии воздействия на климат SSP2-4.5, в котором выбросы колеблются вокруг текущего уровня. Этот результат подтверждает предыдущие оценки, однако также предполагает более высокую вероятность превышения порога в два градуса Цельсия даже в сценарии низкого воздействия на климат (SSP1-2.6), где выбросы достигают нуля в 2050 году. В то же время превышение роста температуры на два градуса выше доиндустриального уровня не является неизбежным.
Таким образом, оценка ИИ гораздо пессимистичнее оценки Межправительственной группы экспертов Организации Объединенных Наций по изменению климата (МГЭИК). Согласно отчету группы за 2021 год, в сценарии с более низким уровнем загрязнения мир превысит два градуса в 2090-х годах.
Испытания этого лета — невыносимая жара в Центральной России или наводнения в Сочи и Крыму — звенья одной цепи. Подобные аномалии случаются не только в России.
На западе Канады температуры побили рекорды на несколько градусов. Например, новый канадский рекорд — +49,6 °C в деревне Литтон. Позже эта деревня и вовсе была уничтожена лесным пожаром. В Германии, Бельгии, Люксембурге, Нидерландах и Швейцарии произошли сильные наводнения, в которых погибло множество людей.
Климатический кризис затронет все континенты: волны жары, засуха, тайфуны и ураганы вызывают массовые разрушения по всему миру. 90% подобных катастроф связаны именно с климатом, и каждый год они обходятся мировой экономике в 520 млрд долларов.
Например, ураган «Катрина» в 2005 году нанес ущерб на 215 млрд долларов, а «Харви» в 2017-м — на 125 млрд. Развитые страны поставили коллективную цель — до 2025 года выделять ежегодно 100 млрд долларов на сокращение выбросов и повышение устойчивости к последствиям изменения климата в развивающихся странах. После будет поставлена новая и более высокая цель.
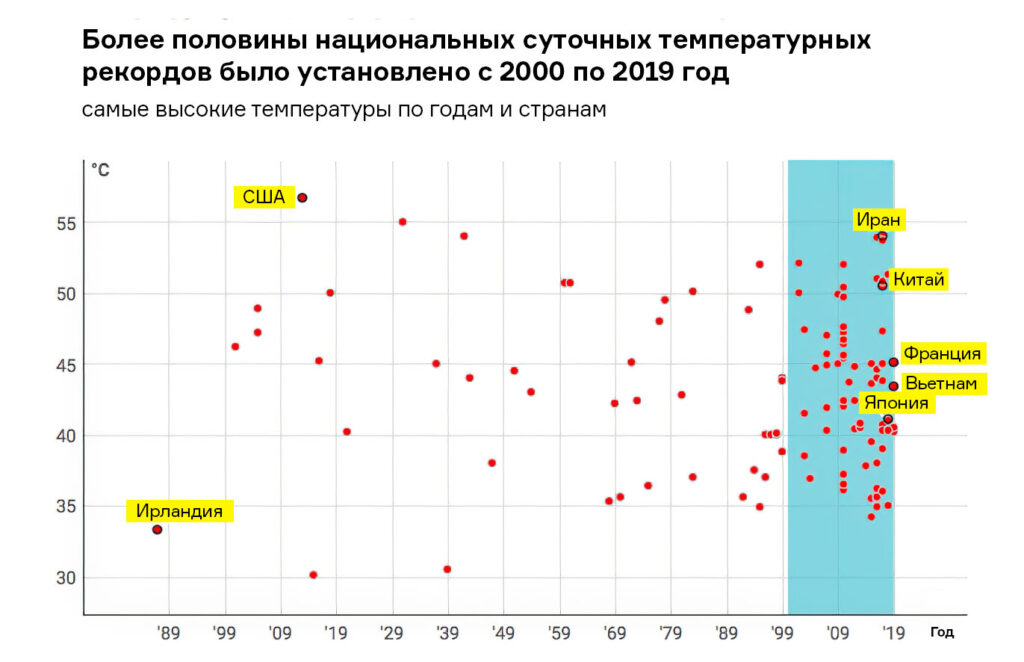
Последнее десятилетие было самым теплым за 125 тысяч лет. Средняя глобальная температура с 2015 по 2019 годы повысилась на 1,1 °C по сравнению с доиндустриальным периодом и на 0,2 °C — по сравнению с предыдущими пятью годами.
На сайте BBC можно посмотреть, насколько потеплеет в конкретном городе на планете к 2100 году при разных климатических сценариях.
Например, при самом оптимистичном сценарии в Москве средняя температура к 2100 году составит −5,1 °C (в январе) и +20,1 °C (в июле). А при худшем — +0,9 °C и +24,6 °C соответственно.
В чем проблема с потеплением
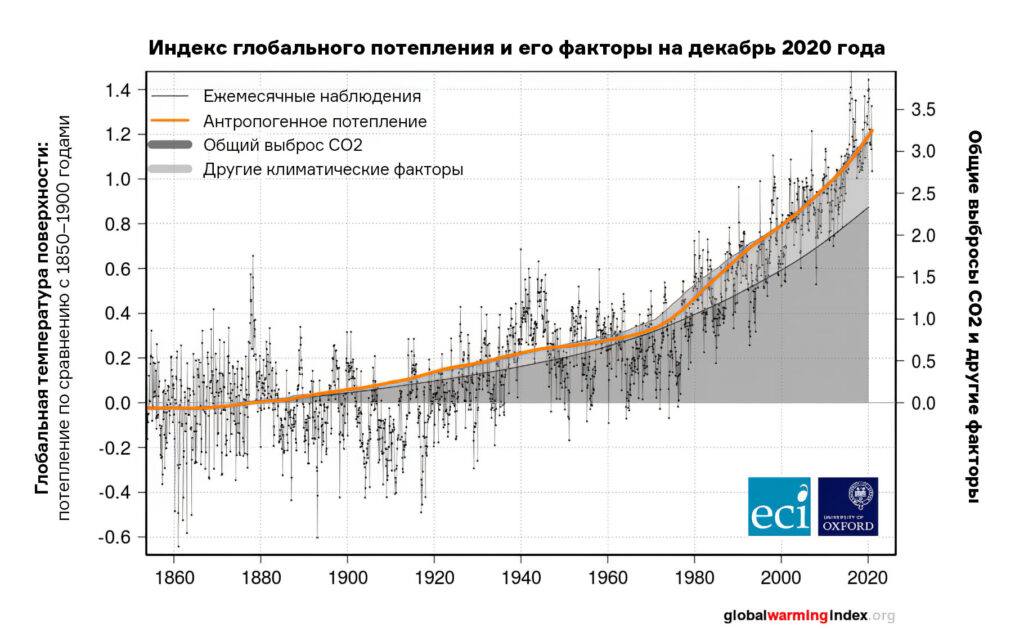
Естественный парниковый эффект — это нормально, он характерен для жизненного цикла Земли, которая медленно, но нагревается. Настоящее воздействие естественных источников потепления климата (солнце и вулканы) ученые оценивают как близкое к нулю. А вот вмешательство человека (антропогенное), наоборот, влияет на 100%. К самым известным парниковым газам относятся:
- углекислый газ,
- метан,
- озон,
- водяной пар.
Наша планета нагревается быстрее, чем раньше, из-за повышенной концентрации парниковых газов, вызванной деятельностью человека. Мы производим рекордно высокое количество выбросов — и ускоряем естественный процесс в разы. Это подтверждают данные нового доклада Межправительственной группы экспертов по климату при ООН (МГЭИК). Краткое резюме можно прочитать здесь.
Это и привело человечество к климатическому кризису.
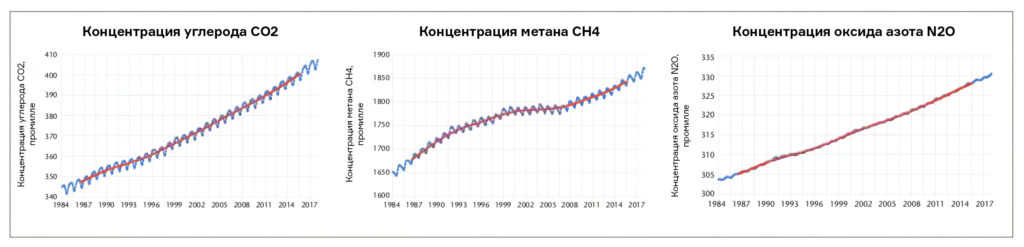
Выбросы CO₂ — главная причина антропогенного изменения климата. На 5 основных парниковых газов: углекислый газ (CO₂), метан (CH₄), оксид азота (N₂O), ХФУ-12 и ХФУ-11 — приходится около 96% всех выбросов с 1750 года. Оставшиеся 4% — на 15 других газов.
Когда мы выбрасываем в атмосферу слишком много парниковых газов, мы перекрываем способность лесов и океанов поглощать их, превращая наших величайших естественных союзников в борьбе с потеплением во врагов. Например, увеличение концентрации CO₂ в океане привело к повышению его кислотности. От этого страдают и массово умирают многие живые организмы и экосистемы и, соответственно, люди. А деревья из-за накопления большего количества углекислого газа активнее растут — но при этом сама древесина истощается и растения быстрее погибают.
Упавшие деревья, разлагающиеся в лесу, — источник метана. Тропические леса Бразилии начали не поглощать, а выделять углекислый газ из-за изменений климата!
Без вмешательства человека аномальная жара случалась бы раз в 1000 лет, но теперь прежде непривычные явления будут происходить постоянно — примерно в 150 раз чаще, чем раньше. При условии глобального потепления на 2 °C — каждые 5–10 лет. Сейчас мы достигли показателя в 1,2 °C. По последним данным, уровень 1,5 °C человечество пройдет в начале 2030-х годов. Это и есть час икс, к которому стоит готовиться тем, кто планирует дожить до середины века.
Василий Яблоков, руководитель климатического направления российского «Гринписа»:
«Наше будущее зависит от усилий, которые будут предприняты в ближайшие 30 лет и дальше. Перед человечеством стоит сложная задача — перейти к углеродной нейтральности к 2050 году. Если это удастся сделать, то у нас есть шанс продолжить жить на этой планете. Конечно, какие-то выбросы будут, но не больше, чем поглощающая способность экосистем. При отсутствии изменений после 2050 года мир не рухнет, но вероятность стабильности климата будет крайне низкая. Увеличится количество экстремальных погодных явлений, несущих ущерб здоровью и экономике».
Наше будущее: климатический кризис
Всё это будет максимально разрушительно для человечества: вымирание видов, распространение болезней, невыносимая жара, разрушение экосистем, затопление городов и т. д. Эти последствия изменения климата ускоряются и неизбежно станут болезненно очевидными до того, как ребенку, родившемуся сегодня, исполнится 30 лет.
Что изменится
1. Вода
Ледники и ледяные щиты в полярных и горных регионах тают быстрее, чем когда-либо, поэтому уровень моря растет. Площади морского льда в Арктике и Антарктике становятся всё меньше, лед в ледяных покровах Гренландии и Антарктики теряет массу. Это значит, что планета отражает солнечное тепло всё хуже — и это дополнительно нагревает ее.
Почти 2/3 городов мира расположены в районах, где высок риск повышения уровня моря, и почти 40% населения мира проживает в пределах 100 км от побережья. В 2050 году в прибрежных городах сотни миллионов людей будут подвергаться риску смертельных наводнений и более частым штормовым приливам.
Целые районы Нью-Йорка, Шанхая, Абу-Даби, Осаки, Рио-де-Жанейро и многих других городов могут оказаться под водой в течение нашей жизни.
Нагревание океанов ставит под угрозу экосистемы. Вдобавок океаны поглощают много углекислого газа, что делает воду в них более кислой и враждебной морской флоре и фауне. Мы уже сейчас видим, как приходит в упадок образ жизни, основанный на рыбной ловле.
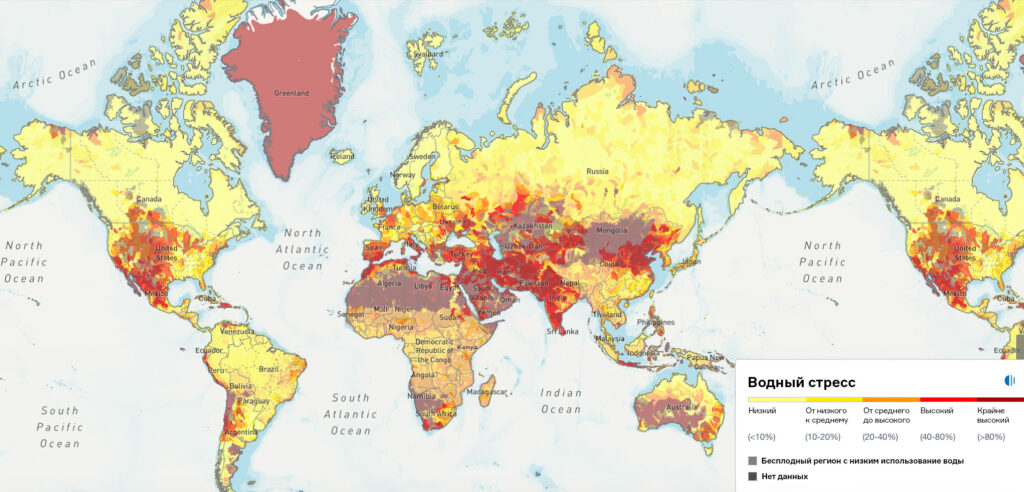
На карте водного стресса дела у России обстоят не так плохо, как у многих соседей. Исключения — эти города и территории рядом с ними:
- Санкт-Петербург,
- Москва,
- Самара,
- Липецк,
- Воронеж,
- Белгород,
- Челябинск,
- Екатеринбург,
- Магнитогорск.
По прогнозам, при глобальном потеплении на 1,5 °C сильные осадки и связанные с ними наводнения усилятся и будут случаться чаще в большинстве регионов Африки и Азии, Северной Америки и Европы.
2. Почва и продовольственная безопасность
Из-за изменения климата деградирует почва — например, происходит эрозия, когда под влиянием антропогенных и природных факторов разрушается верхний слой земли. В итоге в ней не остается питательных веществ, которые необходимы для сельскохозяйственной деятельности. Почва становится неплодородной, а у людей остается всё меньше территорий для производства продуктов.
3. Воздух
Океаны, леса, растения, деревья и почва многие годы поглощали половину выброшенного нами углекислого газа и делали воздух пригодным для жизни. Сейчас же природа не способна в таком объеме помогать нам, и воздух забит частицами загрязнений. Например, уже сейчас в Лондоне плохое качество воздуха ежегодно приводит к 1000 госпитализаций людей с астмой и заболеваниями легких.
4. Засуха
Засухи случаются, например, в регионах, граничащих со Средиземным морем, Северной Америкой, регионом Амазонки и южной Австралией. Какие-то из них обусловлены естественной изменчивостью, другие — усилением воздействия парниковых газов.
В некоторых местах происходит аридизация: осадков становится меньше, чем испарений, территории становятся менее влажными — а из-за этого экосистема становится менее продуктивной биологически. За этим следует опустынивание.
Марракеш и Волгоград уже сейчас находятся на грани превращения в пустыни. Чрезвычайно жаркие зоны, подобные Сахаре, сейчас занимают менее 1% земной поверхности. Но к 2070 году они могут охватить уже 19%.
5. Лес
Лесов, которые всегда были нашими помощниками, остается всё меньше. Многие вырубают, другие уничтожаются лесными пожарами. На конец июля площадь лесных пожаров в России превысила 785 млн га. А дым от лесных пожаров в Якутии достиг территории США.
6. Экстремальные природные явления
В определенных прибрежных районах повышена влажность воздуха, более высокая температура поверхности моря — отсюда экстремальные ураганы и тропические штормы. Инфраструктура прибрежных городов в Бангладеш, Мексике, Соединенных Штатах и других странах уже страдает от наводнений, в результате которых гибнет много людей, а выжившие вынуждены покидать свои дома. Например, в Пакистане температура воздуха +51,1 °C и коллапс энергосети привели к гибели 8 младенцев в отделении интенсивной терапии больницы.
7. Болезни
Таяние вечной мерзлоты высвобождает древние микробы и вирусы, которые современные люди никогда не встречали, поэтому не имеют к ним иммунитета.
Из-за изменений температуры и режима распределения осадков изменится и поведение насекомых — переносчиков инфекционных заболеваний. Поэтому могут еще шире распространиться малярия и лихорадка денге. Очень опасны холера, респираторные заболевания (плохая экология, плесень в домах из-за влаги от затоплений), недоедание и человеческая устойчивость к антибиотикам.
8. Климатическая миграция
Большую часть времени люди жили в относительно узком диапазоне температур, в местах, где климат поддерживал обильное производство пищи. По мере того как планета нагревается, эти регионы меняются. Скоро огромные территории перестанут быть плодородными.
Все эти климатические коллапсы сделают условия жизни в некоторых регионах мира невыносимыми. Они вытеснят миллионы людей с привычных мест на поиски нового дома. Последствия изменения климата усилят конкуренцию за землю, еду и воду, подпитывая социально-экономическую напряженность и всё чаще приводя к массовому перемещению населения.
Если раньше мы мигрировали куда-то за лучшим образованием и карьерой, за интересной жизнью или к своим любимым, то к середине XXI века люди будут переезжать, чтобы выжить.
Будущие потоки климатических беженцев к 2050 году могут составлять 200 млн человек. Вероятно, кто-то из вас захочет присматривать себе место для выживания ваших детей и внуков уже сейчас? Выбрать будет непросто.
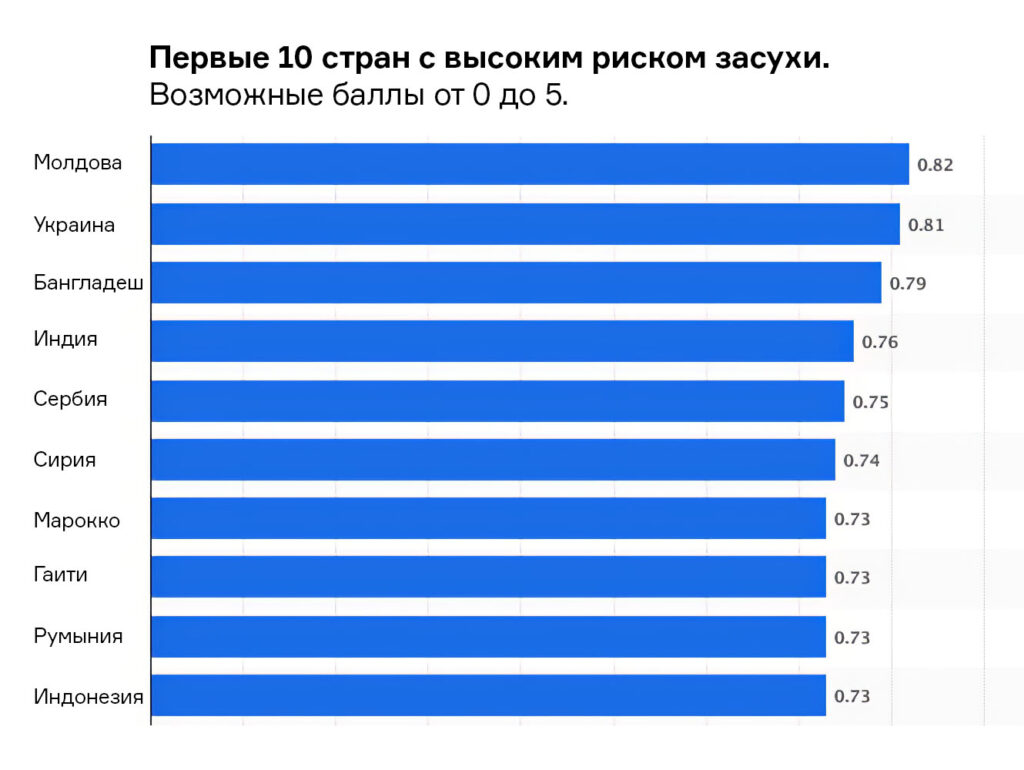
Куда мигрировать не стоит
Молдова, Украина, Бангладеш, Индия, Сербия. Ученые собрали данные 138 стран и составили отчет по рискам засухи в мире. Они учли такие показатели:
- интенсивность засухи в прошлом,
- нехватка воды,
- уязвимость к засухе,
- численность населения,
- урожайность и поголовье скота.
Украина и Молдова были единственными странами, которые относятся к группе высокого риска.
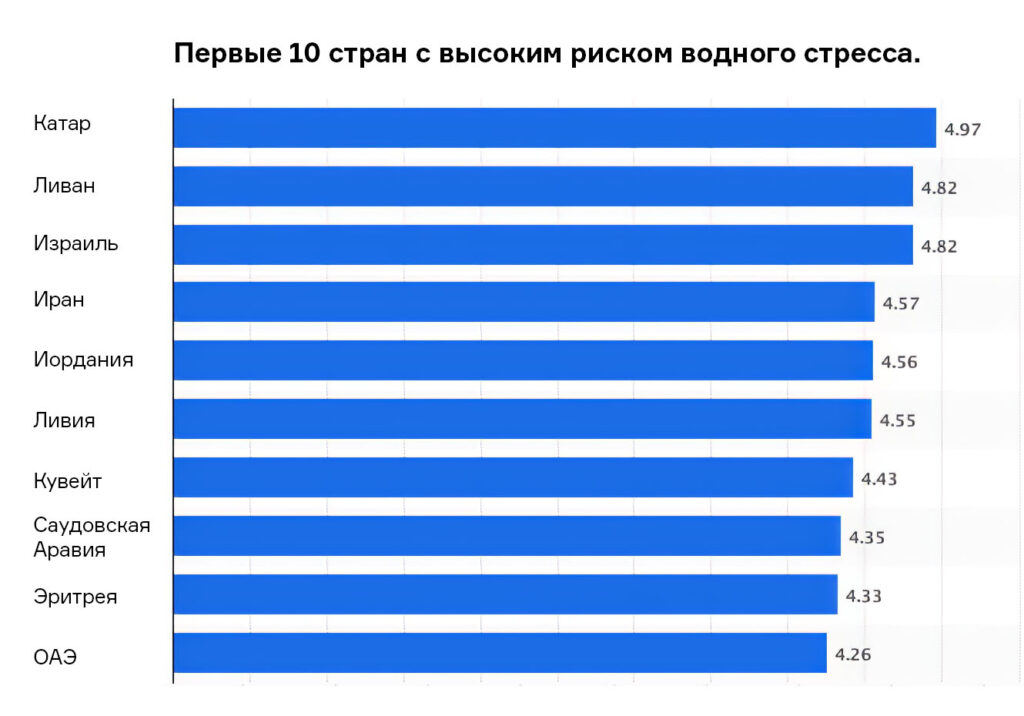
Катар, Ливан, Израиль, Иран, Иордания. Более 25% населения Земли сталкивается с чрезвычайно высокой водной нагрузкой в своих странах. Водный стресс — это нехватка достаточного количества пригодной воды для использования всеми людьми в стране, включая питьевую. Причины — сельское хозяйство и обеспечение нужд промышленности. Дефицит воды есть в Южной Азии, на Ближнем Востоке, в Северной Африке и гораздо менее распространен в Европе.
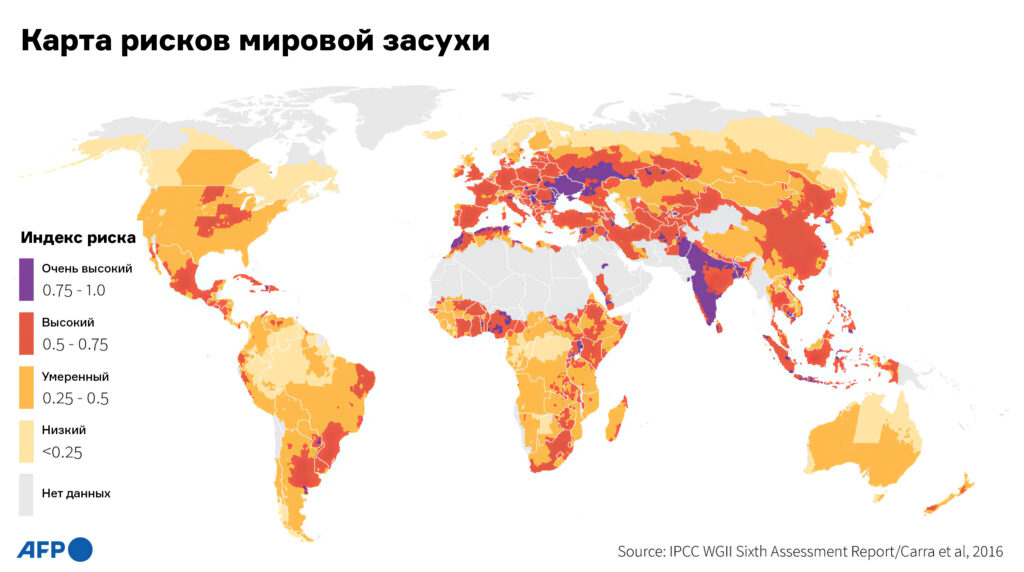
Африка, Латинская Америка, Южная Азия. Засухи, острая нехватка воды и вырубка лесов в этих регионах напрямую приводят к политическим волнениям и насилию. По оценкам Всемирного банка, если ничего не предпринять, более 140 млн человек в странах Африки к югу от Сахары, в Латинской Америке и Южной Азии будут вынуждены мигрировать в пределах своих регионов к 2050 году.
Южная Америка, Юго-Восточная Азия, Средиземноморье. Почти повсюду эти территории могут пострадать от множества климатических бедствий одновременно: засухи, аномальной жары, циклонов, лесных пожаров, наводнений. Всё это усложняет ведение сельского хозяйства. В Южной Америке, например, уменьшится среднегодовое количество осадков и станет суше почва.
К 2050 году приливы охватят большую часть Вьетнама, а также некоторые районы Китая и Таиланда, большую часть южного Ирака и почти всю дельту Нила в Египте. Многие прибрежные районы США тоже находятся в зоне риска.
Индия и Китай. Помимо огромного количества населения стран (на 2021 год — более 1,4 млрд человек), в этих регионах очень высокий риск засухи и водного стресса. К 2100 году температура может подняться до такой степени, что в некоторых районах Индии и Центрального и Восточного Китая выйти на улицу на несколько часов — значит умереть даже для самых приспособленных и здоровых людей.
Мексика и Центральная Америка. Непрекращающиеся негативные обстоятельства: засухи, наводнения, банкротство и голод — заставляют местных жителей уезжать в США. Многие дети хронически голодны, невысокого роста для своего возраста, со слабыми костями и другими проблемами.
Многие полузасушливые районы Гватемалы совсем скоро будут похожи на пустыню. Ожидается, что в некоторых частях страны количество осадков уменьшится на 60%, а количество воды, пополняющей ручьи и поддерживающей влажность почвы, снизится на целых 83%. По прогнозу, к 2070 году урожайность некоторых основных сельскохозяйственных культур снизится на треть. В самых экстремальных климатических сценариях более 30 млн мигрантов направятся к границе США в течение следующих 30 лет.
Острова и береговые зоны. При поднятии уровня Мирового океана первый удар возьмут на себя регионы, которые находятся рядом с водой. К 2100 году уровень моря на Мальдивах повысится примерно на 50 см, это означает, что 200 островов уйдут под воду, а остальные сильно пострадают. Страна уже пытается найти деньги на укрепление своих прибрежных зон. На это необходимо около 9 млрд долларов. К концу века 13 млн жителей прибрежных районов США мигрируют ближе к центру страны из-за затопления территорий. Островные государства Тихого океана уже страдают от приливов, катастрофических циклонов, продолжительных засух, повышения солености грунтовых вод, что делает невозможным выращивание сельскохозяйственных культур, и потери низменных островов из-за повышения уровня моря.
Ситуация с Тихоокеанским регионом — пример климатической несправедливости. Регион с самым низким уровнем выбросов углерода в мире, на долю которого приходится всего 0,23% глобальных выбросов, пострадал от некоторых из самых ранних и серьезных последствий повышения глобальных температур.
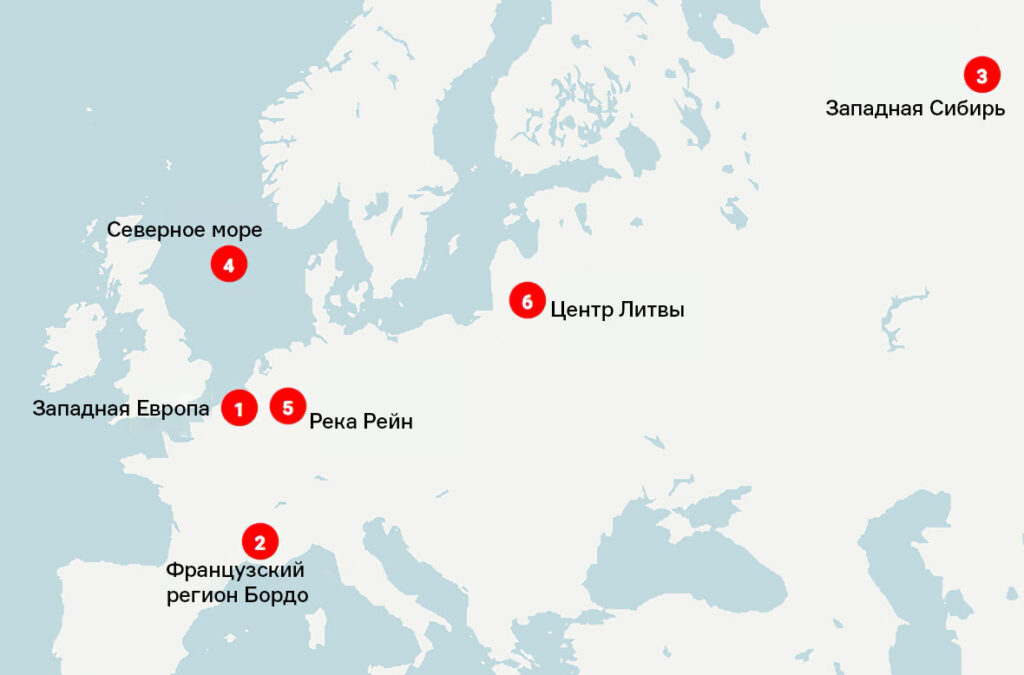
Европа. Исходя из данных по засухам, аномальной жаре и водному стрессу, в этом регионе также будет некомфортно жить.
- Жара в Западной Европе в 2019 году установила новые региональные температурные рекорды в Германии, Франции, Бельгии и других странах.
- Регион Бордо во Франции — один из многих экономически и культурно важных винодельческих районов, которым угрожает усиление засух.
- Повышение температуры приводит к таянию вечной мерзлоты в Западной Сибири и увеличению риска пожаров в ее бореальных (северных) лесах.
- В Северном море глобальное потепление влияет на планктон и морскую пищевую цепочку, это всё усугубляется давлением перелова.
- Летние засухи угрожают некоторым из наиболее важных коммерческих водных путей Европы, таким как река Рейн, которая так сильно пересохла в 2018 году, что судоходство было закрыто.
- Специфическая география Литвы делает ее европейской страной, наиболее уязвимой к изменению климата; здесь уже три года подряд наблюдаются разрушительные неурожаи.
Как вычислить потенциально приемлемые места для жизни на Земле будущего
Попробуем спрогнозировать, какие локации в мире будут приемлемы для жизни в будущем, исходя из нескольких факторов:
Помните, что думать об этом и активно пытаться спасти свою жизнь будете не только вы. И хотя мигрировать смогут только физически здоровые люди с какими-то ресурсами, их будет очень много. При этом надо помнить, что на Земле нет континента «Ноев ковчег», на котором спасутся все.
Топ-3 мест для жизни в эпоху климатического коллапса
Абсолютно безопасного в экологическом смысле места на Земле в XXI веке не существует. Но постараемся выбрать лучшее из худшего!
Парадокс в том, что сбегать придется сразу от всего: засухи, воды, гор, пожаров и холода. Но в то же время от воды человек далеко не убежит: она ежедневно нужна нам для жизни. Поэтому большинство городов и располагается на берегах рек или побережье морей и океанов. Получается, что надо быть где-то рядом, но не очень близко.
Россия
Россия кажется не самым плохим вариантом. В РФ огромные территории, много воды, есть потенциал и место для реализации различных бизнес-проектов, пока не так много людей и не 365 дней в году экстремально жарко или холодно.
Конечно, некоторые города и регионы не очень вписываются в концепцию умеренно безопасного будущего:
- Санкт-Петербург (из-за большого количества воды),
- Москва (из-за засухи и водного стресса. Москва вместе с Калькуттой и Тегераном вошла в тройку самых быстро нагревающихся городов мира. За период с 1950 по 2018 годы температура выросла на 1 °C).
- Якутия, Чукотка, часть Красноярского края (из-за низких температур),
- промышленные города с ужасной экологией, например Красноярск, Челябинск или Нижний Тагил.
Можно предположить, что медленнее других загибаться будут:
- Татарстан (есть вода, развитое сельское хозяйство, потенциал к экономическому развитию региона, терпимая экологическая ситуация),
- Байкал и Республика Бурятия (большой запас пресной воды, терпимая экологическая ситуация, есть потенциал к экономическому развитию региона, развитое сельское хозяйство),
- Алтайский край (есть вода, терпимая экологическая ситуация, много земель, потенциал к экономическому развитию региона, развитое сельское хозяйство, близость к Республике Алтай с уникальной природой),
- Ярославская, Вологодская, Костромская области (есть вода, терпимая экологическая ситуация, сельскохозяйственные территории и производства пищевой промышленности, транспортная доступность).
Скандинавия (Швеция, Дания, Финляндия, Норвегия)
Предпочтение здесь стоит отдавать не крупным городам, находящимся на побережье, а маленьким городкам или деревушкам в глубине стран с доступом к воде. Проблемы с водой будут в Стокгольме, на втором месте — Хельсинки, затем Осло и Копенгаген. Экологическая обстановка в этих странах не такая токсичная, как в других. Даже ситуация с воздухом обстоит гораздо лучше, чем у европейских соседей.
Также есть территории, где можно вести экономическую и сельскохозяйственную деятельность, есть технологии и умение обращаться с отходами, развитая система возобновляемых источников энергии и повсеместное использование машин с электродвигателями. Это самые экологически осознанные страны в мире.
Канада (но не вся)
Страна делится по климатическим характеристикам на две части. Северная Канада — труднодоступное и холодное место с нетронутой природой и очень маленьким количеством людей, проживающих на этой территории из-за низких температур (зимой бывает до −50 °С). Поэтому для жизни больше подходит южная часть страны, кроме территорий около городов Калгари и Реджайна — там будет нехватка воды.
Лучше рассмотреть для климатической миграции провинции Квебек, Онтарио или Британская Колумбия. Как и в Скандинавии, показатели загрязнения воздуха в Канаде самые низкие в мире. А еще там много территорий.
И все равно во всех этих регионах будут случаться климатические аномалии и катастрофические природные разрушения.
Есть ли надежда, что всего этого не будет?
В угоду прогрессу, промышленности и безумному потреблению мы выкачиваем из Земли ископаемое топливо, топим лед, вырубаем леса, отравляем воздух и почву — и повышаем температуру планеты. У человечества всего два стратегических варианта действий без возможности проведения генеральной репетиции.
- Встать на экологический путь через боль, слезы и все стадии отрицания и попытаться замедлить необратимые последствия.
- Продолжать, как заведено, и самоуничтожиться.
Климатический кризис — это не просто «климатические изменения». Это процесс не обратить полностью. Но мы можем замедлить его.
Совместные экологические изменения потребуют фундаментальных преобразований во всех аспектах жизни общества: в том, что и в каких объемах потребляем, как выращиваем продовольствие, используем землю, производим упаковку, перевозим товары, перерабатываем отходы и приводим в действие нашу экономику.
К примеру, Европейский союз стремится стать климатически нейтральным к 2050 году, то есть привести экономику к нулевым выбросам парниковых газов. Эта цель лежит в основе Европейской зеленой сделки (документ, отражающий стремление стать первым климатически нейтральным континентом) и плана по глобальным климатическим действиям — Парижского соглашения. К 2030 году ЕС планирует сократить выбросы углеводорода как минимум на 55% по сравнению с уровнем 1990 года.
В докладе МГЭИК представлены пять сценариев, основанных на различных уровнях выбросов CO₂ и других парниковых газов. Согласно сценариям с высоким и очень высоким уровнем выбросов прогнозируется, что к концу столетия глобальное отопление достигнет 3,6 °C и 4,4 °C выше доиндустриального уровня соответственно.
Пока что мы можем решить, какой дивный новый мир ждет нас в недалеком будущем. Изучение графиков, отчетов и цифр выводит из состояния отрицания: ясно, что от климатических катастроф не убежать в другой город или другую страну. А другой планеты у нас пока нет. И не будет, если мы не спасем эту для продолжения научного и технологического прогресса в принципиально новой форме.
P. S.
Скорее всего, к 2100 году глобальное потепление достигнет уровня уже в 3 °C. Несмотря на значительное сокращение ежегодных выбросов CO₂, полностью климат стабилизировать не получится: во-первых, нулевые выбросы так и не будут достигнуты, во-вторых, «старые» концентрации CO₂ живут долго.
Так что запомните мир, каким он был в 2020-х годах: таким его мы больше не увидим.
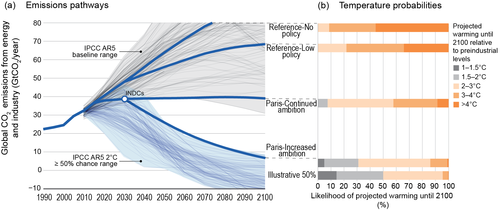
Global CO2 emissions and probabilistic temperature outcomes of different policies
Climate change scenarios or socioeconomic scenarios are projections of future greenhouse gas (GHG) emissions used by analysts to assess future vulnerability to climate change.[1] Scenarios and pathways are created by scientists[2] to survey any long term routes and explore the effectiveness of mitigation and helps us understand what the future may hold this will allow us to envision the future of human environment system.[2] Producing scenarios requires estimates of future population levels, economic activity, the structure of governance, social values, and patterns of technological change. Economic and energy modelling (such as the World3 or the POLES models) can be used to analyze and quantify the effects of such drivers.
Scientists can develop separate international, regional and national climate change scenarios. These scenarios are designed to help stakeholders understand what kinds of decisions will have meaningful effects on climate change mitigation or adaptation. Most countries developing adaptation plans or Nationally Determined Contributions will commission scenario studies in order to better understand the decisions available to them.
International goals for mitigating climate change through international processes like the Intergovernmental Panel on Climate Change (IPCC), the Paris Agreement and Sustainable Development Goal 13 («Take urgent action to combat climate change and its impacts») are based on reviews of these scenarios. For example, the Special Report on Global Warming of 1.5 °C was released in 2018 order to reflect more up-to-date models of emissions, Nationally Determined Contributions, and impacts of climate change than its predecessor IPCC Fifth Assessment Report published in 2014 before the Paris Agreement.[3]
Emissions scenarios[edit]
Global futures scenarios[edit]
These scenarios can be thought of as stories of possible futures. They allow the description of factors that are difficult to quantify, such as governance, social structures, and institutions. Morita et al. assessed the literature on global futures scenarios.[4] They found considerable variety among scenarios, ranging from variants of sustainable development, to the collapse of social, economic, and environmental systems. In the majority of studies, the following relationships were found:
- Rising GHGs: This was associated with scenarios having a growing, post-industrial economy with globalization, mostly with low government intervention and generally high levels of competition. Income equality declined within nations, but there was no clear pattern in social equity or international income equality.
- Falling GHGs: In some of these scenarios, GDP rose. Other scenarios showed economic activity limited at an ecologically sustainable level. Scenarios with falling emissions had a high level of government intervention in the economy. The majority of scenarios showed increased social equity and income equality within and among nations.
Morita et al. (2001) noted that these relationships were not proof of causation.
No strong patterns were found in the relationship between economic activity and GHG emissions. Economic growth was found to be compatible with increasing or decreasing GHG emissions. In the latter case, emissions growth is mediated by increased energy efficiency, shifts to non-fossil energy sources, and/or shifts to a post-industrial (service-based) economy.
Factors affecting emissions growth[edit]
Development trends[edit]
In producing scenarios, an important consideration is how social and economic development will progress in developing countries.[5] If, for example, developing countries were to follow a development pathway similar to the current industrialized countries, it could lead to a very large increase in emissions. Emissions do not only depend on the growth rate of the economy. Other factors include the structural changes in the production system, technological patterns in sectors such as energy, geographical distribution of human settlements and urban structures (this affects, for example, transportation requirements), consumption patterns (e.g., housing patterns, leisure activities, etc.), and trade patterns the degree of protectionism and the creation of regional trading blocks can affect availability to technology.
Baseline scenarios[edit]
A baseline scenario is used as a reference for comparison against an alternative scenario, e.g., a mitigation scenario.[6] In assessing baseline scenarios literature, Fisher et al., it was found that baseline CO2 emission projections covered a large range. In the United States, electric power plants emit about 2.4 billion tons of carbon dioxide (CO2) each year, or roughly 40 percent of the nation’s total emissions. The EPA has taken important first steps by setting standards that will cut the carbon pollution from automobiles and trucks nearly in half by 2025 and by proposing standards to limit the carbon pollution from new power plants.[7]
Factors affecting these emission projections are:
- Population projections: All other factors being equal, lower population projections result in lower emissions projections.
- Economic development: Economic activity is a dominant driver of energy demand and thus of GHG emissions.
- Energy use: Future changes in energy systems are a fundamental determinant of future GHG emissions.
- Energy intensity: This is the total primary energy supply (TPES) per unit of GDP.[8] In all of the baseline scenarios assessments, energy intensity was projected to improve significantly over the 21st century. The uncertainty range in projected energy intensity was large (Fisher et al. 2007).
- Carbon intensity: This is the CO2 emissions per unit of TPES. Compared with other scenarios, Fisher et al. (2007) found that the carbon intensity was more constant in scenarios where no climate policy had been assumed. The uncertainty range in projected carbon intensity was large. At the high end of the range, some scenarios contained the projection that energy technologies without CO2 emissions would become competitive without climate policy. These projections were based on the assumption of increasing fossil fuel prices and rapid technological progress in carbon-free technologies. Scenarios with a low improvement in carbon intensity coincided with scenarios that had a large fossil fuel base, less resistance to coal consumption, or lower technology development rates for fossil-free technologies.
- Land-use change: Land-use change plays an important role in climate change, impacting on emissions, sequestration and albedo. One of the dominant drivers in land-use change is food demand. Population and economic growth are the most significant drivers of food demand.[9][dubious – discuss]
Quantitative emissions projections[edit]
A wide range of quantitative projections of greenhouse gas emissions have been produced.[10] The «SRES» scenarios are «baseline» emissions scenarios (i.e., they assume that no future efforts are made to limit emissions),[11] and have been frequently used in the scientific literature (see Special Report on Emissions Scenarios for details).[12] Greenhouse gas#Projections summarizes projections out to 2030, as assessed by Rogner et al.[13] Other studies are presented here.
Individual studies[edit]
In the reference scenario of World Energy Outlook 2004,[14] the International Energy Agency projected future energy-related CO2 emissions. Emissions were projected to increase by 62% between the years 2002 and 2030. This lies between the SRES A1 and B2 scenario estimates of +101% and +55%, respectively.[15] As part of the IPCC Fourth Assessment Report, Sims et al. (2007) compared several baseline and mitigation scenarios out to the year 2030.[16] The baseline scenarios included the reference scenario of IEA’s World Energy Outlook 2006 (WEO 2006), SRES A1, SRES B2, and the ABARE reference scenario. Mitigation scenarios included the WEO 2006 Alternative policy, ABARE Global Technology and ABARE Global Technology + CCS. Projected total energy-related emissions in 2030 (measured in GtCO2-eq) were 40.4 for the IEA WEO 2006 reference scenario, 58.3 for the ABARE reference scenario, 52.6 for the SRES A1 scenario, and 37.5 for the SRES B2 scenario. Emissions for the mitigation scenarios were 34.1 for the IEA WEO 2006 Alternative Policy scenario, 51.7 for the ABARE Global Technology scenario, and 49.5 for the ABARE Global Technology + CCS scenario.
Garnaut et al. (2008)[17] made a projection of fossil-fuel CO2 emissions for the time period 2005-2030. Their «business-as usual» annual projected growth rate was 3.1% for this period. This compares to 2.5% for the fossil-fuel intensive SRES A1FI emissions scenario, 2.0% for the SRES median scenario (defined by Garnaut et al. (2008) as the median for each variable and each decade of the four SRES marker scenarios), and 1.6% for the SRES B1 scenario. Garnaut et al. (2008) also referred to projections over the same time period of the: US Climate Change Science Program (2.7% max, and 2.0% mean), International Monetary Fund’s 2007 World Economic Outlook (2.5%), Energy Modelling Forum (2.4% max, 1.7% mean), US Energy Information Administration (2.2% high, 1.8% medium, and 1.4% low), IEA’s World Energy Outlook 2007 (2.1% high, 1.8 base case), and the base case from the Nordhaus model (1.3%).
The central scenario of the International Energy Agency publication World Energy Outlook 2011 projects a continued increase in global energy-related CO
2 emissions, with emissions reaching 36.4 Gt in the year 2035.[18] This is a 20% increase in emissions relative to the 2010 level.[18]
UNEP 2011 synthesis report[edit]
The United Nations Environment Programme (UNEP, 2011)[19]: 7 looked at how world emissions might develop out to the year 2020 depending on different policy decisions. To produce their report, UNEP (2011)[19]: 8 convened 55 scientists and experts from 28 scientific groups across 15 countries.
Projections, assuming no new efforts to reduce emissions or based on the «business-as-usual» hypothetical trend,[20] suggested global emissions in 2020 of 56 gigatonnes CO
2-equivalent (GtCO
2-eq), with a range of 55-59 GtCO
2-eq.[19]: 12 In adopting a different baseline where the pledges to the Copenhagen Accord were met in their most ambitious form, the projected global emission by 2020 will still reach the 50 gigatonnes CO
2.[21] Continuing with the current trend, particularly in the case of low-ambition form, there is an expectation of 3° Celsius temperature increase by the end of the century, which is estimated to bring severe environmental, economic, and social consequences.[22] For instance, warmer air temperature and the resulting evapotranspiration can lead to larger thunderstorms and greater risk from flash flooding.[23]
Other projections considered the effect on emissions of policies put forward by UNFCCC Parties to address climate change. Assuming more stringent efforts to limit emissions lead to projected global emissions in 2020 of between 49-52 GtCO
2-eq, with a median estimate of 51 GtCO
2-eq.[19]: 12 Assuming less stringent efforts to limit emissions lead to projected global emissions in 2020 of between 53-57 GtCO
2-eq, with a median estimate of 55 GtCO
2-eq.[19]: 12
National climate (change) projections[edit]
National climate (change) projections (also termed «national climate scenarios» or «national climate assessments») are specialized regional climate projections, typically produced for and by individual countries. What distinguishes national climate projections from other climate projections is that they are officially signed off by the national government, thereby being the relevant national basis for adaptation planning. Climate projections are commonly produced over several years by countries’ national meteorological services or academic institutions working on climate change.
Typically distributed as a single product, climate projections condense information from multiple climate models, using multiple greenhouse gas emission pathways (e.g. Representative Concentration Pathways) to characterize different yet coherent climate futures. Such a product highlights plausible climatic changes through the use of narratives, graphs, maps, and perhaps raw data. Climate projections are often publicly available for policy-makers, public and private decision makers, as well as researchers to undertake further climate impact studies, risk assessments, and climate change adaptation research. The projections are updated every few years, in order to incorporate new scientific insights and improved climate models.
Aims[edit]
National climate projections illustrate plausible changes to a country’s climate in the future. By using multiple emission scenarios, these projections highlight the impact different global mitigation efforts have on variables, including temperature, precipitation, and sunshine hours. Climate scientists strongly recommend the use of multiple emission scenarios in order to ensure that decisions are robust to a range of climatic changes. National climate projections form the basis of national climate adaptation and climate resilience plans, which are reported to UNFCCC and used in IPCC assessments.
Design[edit]
To explore a wide range of plausible climatic outcomes and to enhance confidence in the projections, national climate change projections are often generated from multiple general circulation models (GCMs). Such climate ensembles can take the form of perturbed physics ensembles (PPE), multi-model ensembles (MME), or initial condition ensembles (ICE).[24] As the spatial resolution of the underlying GCMs is typically quite coarse, the projections are often downscaled, either dynamically using regional climate models (RCMs), or statistically. Some projections include data from areas which are larger than the national boundaries, e.g. to more fully evaluate catchment areas of transboundary rivers. Some countries have also produced more localized projections for smaller administrative areas, e.g. States in the United States, and Länder in Germany.
Various countries have produced their national climate projections with feedback and/or interaction with stakeholders.[25] Such engagement efforts have helped tailoring the climate information to the stakeholders’ needs, including the provision of sector-specific climate indicators such as degree-heating days. In the past, engagement formats have included surveys, interviews, presentations, workshops, and use-cases. While such interactions helped not only to enhance the usability of the climate information, it also fostered discussions on how to use climate information in adaptation projects. Interestingly, a comparison of the British, Dutch, and Swiss climate projections revealed distinct national preferences in the way stakeholders were engaged, as well as how the climate model outputs were condensed and communicated.[25]
Examples[edit]
Over 30 countries have reported national climate projections / scenarios in their most recent National Communications to United Nations Framework Convention on Climate Change. Many European governments have also funded national information portals on climate change.[26]
- Australia: CCIA[27]
- California: Cal-Adapt[28]
- Netherlands: KNMI’14[29]
- Switzerland: CH2011[30] / CH2018[31]
- UK: UKCP09 / UKCP18[32][33]
For countries which lack adequate resources to develop their own climate change projections, organisations such as UNDP or FAO have sponsored development of projections and national adaptation programmes (NAPAs).[34][35]
Applications[edit]
National climate projections are widely used to predict climate change impacts in a wide range of economic sectors, and also to inform climate change adaptation studies and decisions. Some examples include:
- Energy[36]
- Water[37]
- Agriculture and forestry:[38][39] effects of climate change on agriculture
- Fisheries
- Ecosystems and Biodiversity:[40] effects of climate change on oceans, effects of climate change on terrestrial animals, effects of climate change on plant biodiversity
- Health:[41] effects of climate change on human health
- Transport[42]
- Coastal areas[43]
- Tourism[44]
- Insurance[45]
- Infrastructure[46]
- Cities and urban environments[47]
- Disaster risk[48]
- Human migration (across many nations and relevant to nations’ border control, migration policies and climate adaptation)[49]
Comparisons[edit]
A detailed comparison between some national climate projections have been carried out.[25][50]
Global long-term scenarios[edit]
In 2021, researchers who found that projecting effects of greenhouse gas emissions only for up to 2100, as widely practiced in research and policy-making, is short-sighted modeled RCPs climate change scenarios and their effects for up to 2500.[51][52]

Projections for crop suitability to 2100 and 2500 under the moderate–high RCP6.0 emission scenario
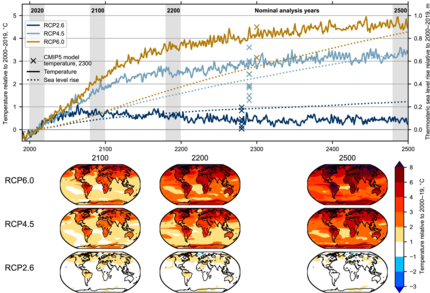
Global mean near-surface air temperature and thermosteric sea-level rise anomalies relative to the 2000–2019 mean for RCP scenarios

Mean number of months per year where heat stress exceeds 38°C (UTCI scale) in present (2020) and future climates
Being able to reduce greenhouse gas emissions will require many major transitions: including massive reduction of fossil fuels, producing and distributing low-emission energy sources, changing to various other energy providers, and, maybe most important, conserving energy and being more efficient with it. If fossil fuels continue to be burnt and vented to the environment, GHG emissions will be very hard to reduce.[53]
Mitigation scenarios[edit]

Scenarios of global greenhouse gas emissions. If all countries achieve their current Paris Agreement pledges, average warming by 2100 will go far beyond the target of the Paris Agreement to keep warming «well below 2°C».
Climate change mitigation scenarios are possible futures in which global warming is reduced by deliberate actions, such as a comprehensive switch to energy sources other than fossil fuels. These are actions that minimize emissions so atmospheric greenhouse gas concentrations are stabilized at levels that restrict the adverse consequences of climate change. Using these scenarios, the examination of the impacts of different carbon prices on an economy is enabled within the framework of different levels of global aspirations.[54]
A typical mitigation scenario is constructed by selecting a long-range target, such as a desired atmospheric concentration of carbon dioxide (CO2), and then fitting the actions to the target, for example by placing a cap on net global and national emissions of greenhouse gases.
An increase of global temperature by more than 2 °C has come to be the majority definition of what would constitute intolerably dangerous climate change with efforts to limit the temperature increase to 1.5 °C above pre-industrial levels per the Paris Agreement. Some climate scientists are increasingly of the opinion that the goal should be a complete restoration of the atmosphere’s preindustrial condition, on the grounds that too protracted a deviation from those conditions will produce irreversible changes.[citation needed]
Stabilization wedges[edit]
A stabilization wedge (or simply «wedge») is an action which incrementally reduces projected emissions. The name is derived from the triangular shape of the gap between reduced and unreduced emissions trajectories when graphed over time. For example, a reduction in electricity demand due to increased efficiency means that less electricity needs to be generated and thus fewer emissions need to be produced. The term originates in the Stabilization Wedge Game. As a reference unit, a stabilization wedge is equal to the following examples of mitigation initiatives: deployment of two hundred thousand 10 MW wind turbines; completely halting the deforestation and planting of 300 million hectares of trees; the increase in the average energy efficiency of all the world’s buildings by 25 percent;[when?] or the installation of carbon capture and storage facilities in 800 large coal-fired power plants.[55] Pacala and Socolow proposed in their work, Stabilization Wedges, that seven wedges are required to be delivered by 2050 – at current technologies – to make a significant impact on the mitigation of climate change.[56] There are, however, sources that estimate the need for 14 wedges because Pacala and Socolow’s proposal would only stabilize carbon dioxide emissions at current levels but not the atmospheric concentration, which is increasing by more than 2 ppm/year.[55] In 2011, Socolow revised their earlier estimate to nine.[57]
Target levels of CO2[edit]
Contributions to climate change, whether they cool or warm the Earth, are often described in terms of the radiative forcing or imbalance they introduce to the planet’s energy budget. Now and in the future, anthropogenic carbon dioxide is believed to be the major component of this forcing, and the contribution of other components is often quantified in terms of «parts-per-million carbon dioxide equivalent» (ppm CO2e), or the increment/decrement in carbon dioxide concentrations which would create a radiative forcing of the same magnitude.
450 ppm[edit]
The BLUE scenarios in the IEA’s Energy Technology Perspectives publication of 2008 describe pathways to a long-range concentration of 450 ppm. Joseph Romm has sketched how to achieve this target through the application of 14 wedges.[58]
World Energy Outlook 2008, mentioned above, also describes a «450 Policy Scenario», in which extra energy investments to 2030 amount to $9.3 trillion over the Reference Scenario. The scenario also features, after 2020, the participation of major economies such as China and India in a global cap-and-trade scheme initially operating in OECD and European Union countries. Also the less conservative 450 ppm scenario calls for extensive deployment of negative emissions, i.e. the removal of CO2 from the atmosphere. According to the International Energy Agency (IEA) and OECD, «Achieving lower concentration targets (450 ppm) depends significantly on the use of BECCS».[59]
550 ppm[edit]
This is the target advocated (as an upper bound) in the Stern Review. As approximately a doubling of CO2 levels relative to preindustrial times, it implies a temperature increase of about three degrees, according to conventional estimates of climate sensitivity. Pacala and Socolow list 15 «wedges», any 7 of which in combination should suffice to keep CO2 levels below 550 ppm.[60]
The International Energy Agency’s World Energy Outlook report for 2008 describes a «Reference Scenario» for the world’s energy future «which assumes no new government policies beyond those already adopted by mid-2008», and then a «550 Policy Scenario» in which further policies are adopted, a mixture of «cap-and-trade systems, sectoral agreements and national measures». In the Reference Scenario, between 2006 and 2030 the world invests $26.3 trillion in energy-supply infrastructure; in the 550 Policy Scenario, a further $4.1 trillion is spent in this period, mostly on efficiency increases which deliver fuel cost savings of over $7 trillion.[61]
Other greenhouse gases[edit]
Greenhouse gas concentrations are aggregated in terms of carbon dioxide equivalent. Some multi-gas mitigation scenarios have been modeled by Meinshausen et al.[62]
As a short-term focus[edit]
In a 2000 paper,[63] Hansen argued that the 0.75 °C[failed verification] rise in average global temperatures over the last 100 years has been driven mainly by greenhouse gases other than carbon dioxide, since warming due to CO2 had been offset by cooling due to aerosols, implying the viability of a strategy initially based around reducing emissions of non-CO2 greenhouse gases and of black carbon, focusing on CO2 only in the longer run.[64]
This was also argued by Veerabhadran Ramanathan and Jessica Seddon Wallack in the September/October 2009 Foreign Affairs.[65]
See also[edit]
- 4 Degrees and Beyond International Climate Conference
- Bio-energy with carbon capture and storage (BECCS)
- Carbon dioxide removal (CDR)
- Carbon negative fuel
- Climate engineering (geoengineering)
- Emissions trading
- Energy modeling
- Virgin Earth Challenge
- Drawdown (climate)
- CMIP
- Copernicus Programme
- Ensemble forecasting
- Sensitivity analysis
- Uncertainty analysis
- Scenario planning
References[edit]
- ^ Carter, T.R.; et al. (2001). «Developing and Applying Scenarios. In: Climate Change 2001: Impacts, Adaptation and Vulnerability. Contribution of Working Group II to the Third Assessment Report of the Intergovernmental Panel on Climate Change [J.J. McCarthy et al. Eds.]». Cambridge University Press, Cambridge, U.K., and New York, N.Y., U.S.A. Archived from the original on 2018-10-05. Retrieved 2010-01-10.
- ^ a b «IPCC AR6 WG3 Ch3» (PDF).
- ^ Press release: Special Report on Global Warming of 1.5ºC (PDF) (Report). Incheon, Republic of Korea: Intergovernmental Panel on Climate Change (IPCC). 8 October 2018. Retrieved 7 October 2018.
- ^ Morita, T.; et al. (2001). «Greenhouse Gas Emission Mitigation Scenarios and Implications. In: Climate Change 2001: Mitigation. Contribution of Working Group III to the Third Assessment Report of the Intergovernmental Panel on Climate Change [B. Metz et al. Eds.]». Cambridge University Press, Cambridge, U.K., and New York, N.Y., U.S.A. Archived from the original on 2018-10-05. Retrieved 2010-01-10.
- ^ Fisher, B.S.; et al. (2007). «Issues related to mitigation in the long term context. In: Climate Change 2007: Mitigation. Contribution of Working Group III to the Fourth Assessment Report of the Intergovernmental Panel on Climate Change [B. Metz et al. Eds.]». Cambridge University Press, Cambridge, U.K., and New York, N.Y., U.S.A. Archived from the original on 2018-10-05. Retrieved 2009-05-20.
- ^ IPCC (2007c). «Annex. In: Climate Change 2007: Mitigation. Contribution of Working Group III to the Fourth Assessment Report of the Intergovernmental Panel on Climate Change [B. Metz et al. Eds.]». Cambridge University Press, Cambridge, U.K., and New York, N.Y., U.S.A. Archived from the original on 2018-10-05. Retrieved 2009-05-20.
- ^ «Using the Clean Air Act to Sharply Reduce Carbon Pollution from Existing Power Plants». Natural Resources Defense Counsel. Retrieved October 9, 2013.
- ^ Rogner, H.-H.; et al. (2007). «Introduction. In: Climate Change 2007: Mitigation. Contribution of Working Group III to the Fourth Assessment Report of the Intergovernmental Panel on Climate Change [B. Metz et al. Eds.]». Cambridge University Press, Cambridge, U.K., and New York, N.Y., U.S.A. Archived from the original on 2018-10-05. Retrieved 2009-05-20.
- ^ Fisher, B.S.; et al. (2007). ««3.2.1.6 Land-use change and land-use management.» In [book chapter]: «Issues related to mitigation in the long term context.» In [book]: «Climate Change 2007: Mitigation. Contribution of Working Group III to the Fourth Assessment Report of the Intergovernmental Panel on Climate Change [B. Metz et al. Eds.]». Print version: Cambridge University Press, Cambridge, U.K., and New York, N.Y., U.S.A.. This version: IPCC website. Archived from the original on 2010-04-25. Retrieved 2010-03-18.
- ^ Fisher; et al., «Chapter 3: Issues related to mitigation in the long-term context», Archived copy, Sec. 3.1 Emissions scenarios, archived from the original on 2018-11-16, retrieved 2012-09-08
{{citation}}: CS1 maint: archived copy as title (link), in IPCC AR4 WG3 2007 - ^ Morita; et al., «Chapter 2, Greenhouse Gas Emission Mitigation Scenarios and Implications», Archived copy, Sec. 2.5.1.1 IPCC Emissions Scenarios and the SRES Process, archived from the original on 2013-07-06, retrieved 2012-09-08
{{citation}}: CS1 maint: archived copy as title (link), in IPCC TAR WG3 2001. - ^
Karl, TR; et al., eds. (2009), «Global climate change», Global Climate Change Impacts in the United States, New York, NY, USA: Cambridge University Press, p. 22, ISBN 978-0-521-14407-0, archived from the original on 2012-09-15 - ^
Rogner, H.-H.; et al., «Introduction», Sec 1.3.2 Future outlook , in IPCC AR4 WG3 2007 - ^ IEA (2004). World Energy Outlook 2004 (PDF). World Energy Outlook website. p. 74.
- ^ Section 4.3.1, Fossil fuels Archived 2012-09-10 at the Wayback Machine, in IPCC AR4 WG3 2007.
- ^ Section 4.4.1, Carbon dioxide emissions from energy supply by 2030 Archived 2012-09-10 at the Wayback Machine, in IPCC AR4 WG3 2007.
- ^ Garnaut, R.; Howes, S.; Jotzo, F.; Sheehan, P. (2008). «Emissions in the Platinum Age: the implications of rapid development for climate-change mitigation» (PDF). Oxford Review of Economic Policy. 24 (2): 392. doi:10.1093/oxrep/grn021. Archived from the original (PDF) on 2012-03-21. Retrieved 2012-09-08.
- ^ a b
International Energy Agency (IEA) (2011), World Energy Outlook 2011: Fact Sheets (PDF), Paris, France: IEA, p. 2, ISBN 978-92-64-12413-4 - ^ a b c d e
UNEP (November 2011), Bridging the Emissions Gap: A UNEP Synthesis Report (PDF), Nairobi, Kenya: United Nations Environment Programme (UNEP), ISBN 978-92-807-3229-0 UNEP Stock Number: DEW/1470/NA - ^ Fozzard, Adrian (2014). Climate Change Public Expenditure and Institutional Review Sourcebook (CCPEIR). Washington, D.C.: World Bank Publications. p. 92.
- ^ Alam, Shawkat; Bhuiyan, Jahid; Chowdhury, Tareq; Techera, Erika (2013). Routledge Handbook of International Environmental Law. London: Routledge. p. 373. ISBN 9780415687171.
- ^ Govaere, Inge; Poli, Sara (2014). EU Management of Global Emergencies: Legal Framework for Combating Threats and Crises. Leiden: BRILL Nijhoff. p. 313. ISBN 9789004268326.
- ^ van Drunen, M.A.; Lasage, R.; Dorland, C. (2006). Climate Change in Developing Countries: Results from the Netherlands Climate Change Studies Assistance Programme. Cambridge, MA: CAB International. p. 52. ISBN 9781845930776.
- ^ Parker, Wendy S. (2012). «Whose Probabilities? Predicting Climate Change with Ensembles of Models». Philosophy of Science. 77 (5): 985–997. doi:10.1086/656815. ISSN 0031-8248. S2CID 121314681.
- ^ a b c Skelton, Maurice; Porter, James J.; Dessai, Suraje; Bresch, David N.; Knutti, Reto (2017-04-26). «The social and scientific values that shape national climate scenarios: a comparison of the Netherlands, Switzerland and the UK». Regional Environmental Change. 17 (8): 2325–2338. doi:10.1007/s10113-017-1155-z. ISSN 1436-3798. PMC 6959399. PMID 32009852.
- ^
Füssel, Hans-Martin (2014). How Is Uncertainty Addressed in the Knowledge Base for National Adaptation Planning?. In Adapting to an Uncertain Climate. pp. 41-66: Springer, Cham. ISBN 978-3-319-04875-8.{{cite book}}: CS1 maint: location (link) - ^ Climate Change in Australia
- ^ California climate change scenarios and climate impact research
- ^ KNMI’14 Pictures of the future — Climate scenarios
- ^ «Swiss Climate Change Scenarios CH2011 B». ch2011.ch. Retrieved 2018-08-23.
- ^ CH2018 — New Climate Scenarios for Switzerland
- ^ UKCP18 Project announcement
- ^ UKCP18 Demonstration Projects (Met Office)
- ^ UNDP — Supporting Integrated Climate Change Strategies
- ^ UNFCCC — National Adaptation Programmes of Action — Introduction
- ^ European Climatic Energy Mixes (ECEM)
- ^ California’s Climate Adaptation Strategy for Water
- ^ Climate-ADAPT EU sector policies — Agriculture
- ^ Switzerland: Climate change impacts on tree species, forest properties, and ecosystem services
- ^ BACC – The Baltex Assessment of Climate Change for the Baltic Sea basin
- ^ «Health effects of climate change in the UK 2012». Archived from the original on 2013-11-04. Retrieved 2021-03-14.
- ^ UK’s Climate change national adaptation programme: transport
- ^ «The Netherland’s Delta Programme 2018 — Continuing the work on a sustainable and safe delta» (PDF). Archived from the original (PDF) on 2018-11-05. Retrieved 2021-03-14.
- ^ Copernicus climate data boosts Europe’s tourism sector[permanent dead link]
- ^ «SwissRe: The Economics of Climate Adaptation». Archived from the original on 2018-11-06. Retrieved 2021-03-14.
- ^ Infrastructure, Engineering and Climate Change Adaptation – ensuring services in an uncertain future
- ^ Australia’s National Climate Resilience and Adaptation Strategy
- ^ UNISDR -Coherence and mutual reinforcement between the Sendai Framework for Disaster Risk Reduction 2015-2030 and international agreements for development and climate action
- ^ «Future of the human climate niche» (PDF). Archived (PDF) from the original on 14 May 2020. Retrieved 25 June 2020.
- ^ National climate change vulnerability and risk assessments in Europe, 2018
- ^ «By 2500 earth could be alien to humans». Scienmag: Latest Science and Health News. 14 October 2021. Retrieved 18 October 2021.
- ^ Lyon, Christopher; Saupe, Erin E.; Smith, Christopher J.; Hill, Daniel J.; Beckerman, Andrew P.; Stringer, Lindsay C.; Marchant, Robert; McKay, James; Burke, Ariane; O’Higgins, Paul; Dunhill, Alexander M.; Allen, Bethany J.; Riel-Salvatore, Julien; Aze, Tracy (2021). «Climate change research and action must look beyond 2100». Global Change Biology. 28 (2): 349–361. doi:10.1111/gcb.15871. ISSN 1365-2486. PMID 34558764. S2CID 237616583.
- ^ «WGII Summary for Policymakers Headline Statements».
- ^ Commonwealth of Australia, “Climate Change Mitigation Scenarios: Modeling report provided to the Climate Change Authority in support of its Caps and Targets Review,” 2013. Retrieved 13 December 2018 from https://www.environment.gov.au/system/files/resources/a28424ae-cce9-48c9-aad2-56b3db0920a5/files/climate-change-mitigation-scenarios.pdf
- ^ a b Dawson, Brian; Spannagle, Matt (2008). The Complete Guide to Climate Change. Oxon: Routledge. pp. 283. ISBN 978-0415477895.
- ^ Pacala, S.; Socolow, R. (2004-08-13). «Stabilization Wedges: Solving the Climate Problem for the Next 50 Years with Current Technologies». Science. 305 (5686): 968–972. Bibcode:2004Sci…305..968P. CiteSeerX 10.1.1.642.8472. doi:10.1126/science.1100103. ISSN 0036-8075. PMID 15310891. S2CID 2203046.
- ^ Socolow, Robert (September 27, 2011). «Wedges reaffirmed — Bulletin of the Atomic Scientists». Bulletin of the Atomic Scientists. Retrieved 2018-08-27.
- ^ Is 450 ppm (or less) politically possible? Part 2: The Solution
- ^ «OECD Environmental Outlook to 2050, Climate Change Chapter, pre-release version» (PDF). OECD. 2011. Retrieved 2012-01-16.
- ^ Pacala, S.; Socolow, R. (13 August 2004). «Stabilization Wedges: Solving the Climate Problem for the Next 50 Years with Current Technologies». Science. 305 (5686): 968–972. Bibcode:2004Sci…305..968P. CiteSeerX 10.1.1.642.8472. doi:10.1126/science.1100103. PMID 15310891. S2CID 2203046.
- ^ http://www.iea.org/weo/docs/weo2008/fact_sheets_08.pdf Archived 2008-11-17 at the Wayback Machine World Energy Outlook 2008 Fact Sheet
- ^ Meinshausen, M.; Hare, B.; Wigley, T. M. M.; Vuuren, D.; Elzen, M. G. J.; Swart, R. (2006). «Multi-gas Emissions Pathways to Meet Climate Targets» (PDF). Climatic Change. 75 (1–2): 151. Bibcode:2006ClCh…75..151M. doi:10.1007/s10584-005-9013-2. hdl:20.500.11850/36894. S2CID 55462579.
- ^ Hansen, James; Sato, Makiko; Ruedy, Reto; Lacis, Andrew; Oinas, Valdar (29 August 2000). «Global warming in the twenty-first century: An alternative scenario». Proceedings of the National Academy of Sciences. 97 (18): 9875–9880. Bibcode:2000PNAS…97.9875H. doi:10.1073/pnas.170278997. PMC 27611. PMID 10944197.
- ^ Review of Hansen et al.: Global Warming in the Twenty-First Century: An Alternative Scenario[permanent dead link]
- ^ Why Black Carbon and Ozone Also Matter
- IPCC TAR WG3 (2001), Metz, B.; Davidson, O.; Swart, R.; Pan, J. (eds.), Climate Change 2001: Mitigation, Contribution of Working Group III to the Third Assessment Report of the Intergovernmental Panel on Climate Change, Cambridge University Press, ISBN 0-521-80769-7, archived from the original on 2017-02-27 (pb: 0-521-01502-2).
- IPCC AR4 WG3 (2007), Metz, B.; Davidson, O.R.; Bosch, P.R.; Dave, R.; Meyer, L.A. (eds.), Climate Change 2007: Mitigation of Climate Change, Contribution of Working Group III to the Fourth Assessment Report of the Intergovernmental Panel on Climate Change, Cambridge University Press, ISBN 978-0-521-88011-4, archived from the original on 2014-10-12, retrieved 2012-09-08 (pb: 978-0-521-70598-1).
External links[edit]
- National climate change vulnerability and risk assessments in Europe, 2018
- Climate-ADAPT portal (large selection of European studies using national climate projections)
- UNDP Climate Change Country Profiles — Introduction;UNDP Climate Change Country Profiles (61 countries)
Global CO2 emissions and probabilistic temperature outcomes of different policies
Climate change scenarios or socioeconomic scenarios are projections of future greenhouse gas (GHG) emissions used by analysts to assess future vulnerability to climate change.[1] Scenarios and pathways are created by scientists[2] to survey any long term routes and explore the effectiveness of mitigation and helps us understand what the future may hold this will allow us to envision the future of human environment system.[2] Producing scenarios requires estimates of future population levels, economic activity, the structure of governance, social values, and patterns of technological change. Economic and energy modelling (such as the World3 or the POLES models) can be used to analyze and quantify the effects of such drivers.
Scientists can develop separate international, regional and national climate change scenarios. These scenarios are designed to help stakeholders understand what kinds of decisions will have meaningful effects on climate change mitigation or adaptation. Most countries developing adaptation plans or Nationally Determined Contributions will commission scenario studies in order to better understand the decisions available to them.
International goals for mitigating climate change through international processes like the Intergovernmental Panel on Climate Change (IPCC), the Paris Agreement and Sustainable Development Goal 13 («Take urgent action to combat climate change and its impacts») are based on reviews of these scenarios. For example, the Special Report on Global Warming of 1.5 °C was released in 2018 order to reflect more up-to-date models of emissions, Nationally Determined Contributions, and impacts of climate change than its predecessor IPCC Fifth Assessment Report published in 2014 before the Paris Agreement.[3]
Emissions scenarios[edit]
Global futures scenarios[edit]
These scenarios can be thought of as stories of possible futures. They allow the description of factors that are difficult to quantify, such as governance, social structures, and institutions. Morita et al. assessed the literature on global futures scenarios.[4] They found considerable variety among scenarios, ranging from variants of sustainable development, to the collapse of social, economic, and environmental systems. In the majority of studies, the following relationships were found:
- Rising GHGs: This was associated with scenarios having a growing, post-industrial economy with globalization, mostly with low government intervention and generally high levels of competition. Income equality declined within nations, but there was no clear pattern in social equity or international income equality.
- Falling GHGs: In some of these scenarios, GDP rose. Other scenarios showed economic activity limited at an ecologically sustainable level. Scenarios with falling emissions had a high level of government intervention in the economy. The majority of scenarios showed increased social equity and income equality within and among nations.
Morita et al. (2001) noted that these relationships were not proof of causation.
No strong patterns were found in the relationship between economic activity and GHG emissions. Economic growth was found to be compatible with increasing or decreasing GHG emissions. In the latter case, emissions growth is mediated by increased energy efficiency, shifts to non-fossil energy sources, and/or shifts to a post-industrial (service-based) economy.
Factors affecting emissions growth[edit]
Development trends[edit]
In producing scenarios, an important consideration is how social and economic development will progress in developing countries.[5] If, for example, developing countries were to follow a development pathway similar to the current industrialized countries, it could lead to a very large increase in emissions. Emissions do not only depend on the growth rate of the economy. Other factors include the structural changes in the production system, technological patterns in sectors such as energy, geographical distribution of human settlements and urban structures (this affects, for example, transportation requirements), consumption patterns (e.g., housing patterns, leisure activities, etc.), and trade patterns the degree of protectionism and the creation of regional trading blocks can affect availability to technology.
Baseline scenarios[edit]
A baseline scenario is used as a reference for comparison against an alternative scenario, e.g., a mitigation scenario.[6] In assessing baseline scenarios literature, Fisher et al., it was found that baseline CO2 emission projections covered a large range. In the United States, electric power plants emit about 2.4 billion tons of carbon dioxide (CO2) each year, or roughly 40 percent of the nation’s total emissions. The EPA has taken important first steps by setting standards that will cut the carbon pollution from automobiles and trucks nearly in half by 2025 and by proposing standards to limit the carbon pollution from new power plants.[7]
Factors affecting these emission projections are:
- Population projections: All other factors being equal, lower population projections result in lower emissions projections.
- Economic development: Economic activity is a dominant driver of energy demand and thus of GHG emissions.
- Energy use: Future changes in energy systems are a fundamental determinant of future GHG emissions.
- Energy intensity: This is the total primary energy supply (TPES) per unit of GDP.[8] In all of the baseline scenarios assessments, energy intensity was projected to improve significantly over the 21st century. The uncertainty range in projected energy intensity was large (Fisher et al. 2007).
- Carbon intensity: This is the CO2 emissions per unit of TPES. Compared with other scenarios, Fisher et al. (2007) found that the carbon intensity was more constant in scenarios where no climate policy had been assumed. The uncertainty range in projected carbon intensity was large. At the high end of the range, some scenarios contained the projection that energy technologies without CO2 emissions would become competitive without climate policy. These projections were based on the assumption of increasing fossil fuel prices and rapid technological progress in carbon-free technologies. Scenarios with a low improvement in carbon intensity coincided with scenarios that had a large fossil fuel base, less resistance to coal consumption, or lower technology development rates for fossil-free technologies.
- Land-use change: Land-use change plays an important role in climate change, impacting on emissions, sequestration and albedo. One of the dominant drivers in land-use change is food demand. Population and economic growth are the most significant drivers of food demand.[9][dubious – discuss]
Quantitative emissions projections[edit]
A wide range of quantitative projections of greenhouse gas emissions have been produced.[10] The «SRES» scenarios are «baseline» emissions scenarios (i.e., they assume that no future efforts are made to limit emissions),[11] and have been frequently used in the scientific literature (see Special Report on Emissions Scenarios for details).[12] Greenhouse gas#Projections summarizes projections out to 2030, as assessed by Rogner et al.[13] Other studies are presented here.
Individual studies[edit]
In the reference scenario of World Energy Outlook 2004,[14] the International Energy Agency projected future energy-related CO2 emissions. Emissions were projected to increase by 62% between the years 2002 and 2030. This lies between the SRES A1 and B2 scenario estimates of +101% and +55%, respectively.[15] As part of the IPCC Fourth Assessment Report, Sims et al. (2007) compared several baseline and mitigation scenarios out to the year 2030.[16] The baseline scenarios included the reference scenario of IEA’s World Energy Outlook 2006 (WEO 2006), SRES A1, SRES B2, and the ABARE reference scenario. Mitigation scenarios included the WEO 2006 Alternative policy, ABARE Global Technology and ABARE Global Technology + CCS. Projected total energy-related emissions in 2030 (measured in GtCO2-eq) were 40.4 for the IEA WEO 2006 reference scenario, 58.3 for the ABARE reference scenario, 52.6 for the SRES A1 scenario, and 37.5 for the SRES B2 scenario. Emissions for the mitigation scenarios were 34.1 for the IEA WEO 2006 Alternative Policy scenario, 51.7 for the ABARE Global Technology scenario, and 49.5 for the ABARE Global Technology + CCS scenario.
Garnaut et al. (2008)[17] made a projection of fossil-fuel CO2 emissions for the time period 2005-2030. Their «business-as usual» annual projected growth rate was 3.1% for this period. This compares to 2.5% for the fossil-fuel intensive SRES A1FI emissions scenario, 2.0% for the SRES median scenario (defined by Garnaut et al. (2008) as the median for each variable and each decade of the four SRES marker scenarios), and 1.6% for the SRES B1 scenario. Garnaut et al. (2008) also referred to projections over the same time period of the: US Climate Change Science Program (2.7% max, and 2.0% mean), International Monetary Fund’s 2007 World Economic Outlook (2.5%), Energy Modelling Forum (2.4% max, 1.7% mean), US Energy Information Administration (2.2% high, 1.8% medium, and 1.4% low), IEA’s World Energy Outlook 2007 (2.1% high, 1.8 base case), and the base case from the Nordhaus model (1.3%).
The central scenario of the International Energy Agency publication World Energy Outlook 2011 projects a continued increase in global energy-related CO
2 emissions, with emissions reaching 36.4 Gt in the year 2035.[18] This is a 20% increase in emissions relative to the 2010 level.[18]
UNEP 2011 synthesis report[edit]
The United Nations Environment Programme (UNEP, 2011)[19]: 7 looked at how world emissions might develop out to the year 2020 depending on different policy decisions. To produce their report, UNEP (2011)[19]: 8 convened 55 scientists and experts from 28 scientific groups across 15 countries.
Projections, assuming no new efforts to reduce emissions or based on the «business-as-usual» hypothetical trend,[20] suggested global emissions in 2020 of 56 gigatonnes CO
2-equivalent (GtCO
2-eq), with a range of 55-59 GtCO
2-eq.[19]: 12 In adopting a different baseline where the pledges to the Copenhagen Accord were met in their most ambitious form, the projected global emission by 2020 will still reach the 50 gigatonnes CO
2.[21] Continuing with the current trend, particularly in the case of low-ambition form, there is an expectation of 3° Celsius temperature increase by the end of the century, which is estimated to bring severe environmental, economic, and social consequences.[22] For instance, warmer air temperature and the resulting evapotranspiration can lead to larger thunderstorms and greater risk from flash flooding.[23]
Other projections considered the effect on emissions of policies put forward by UNFCCC Parties to address climate change. Assuming more stringent efforts to limit emissions lead to projected global emissions in 2020 of between 49-52 GtCO
2-eq, with a median estimate of 51 GtCO
2-eq.[19]: 12 Assuming less stringent efforts to limit emissions lead to projected global emissions in 2020 of between 53-57 GtCO
2-eq, with a median estimate of 55 GtCO
2-eq.[19]: 12
National climate (change) projections[edit]
National climate (change) projections (also termed «national climate scenarios» or «national climate assessments») are specialized regional climate projections, typically produced for and by individual countries. What distinguishes national climate projections from other climate projections is that they are officially signed off by the national government, thereby being the relevant national basis for adaptation planning. Climate projections are commonly produced over several years by countries’ national meteorological services or academic institutions working on climate change.
Typically distributed as a single product, climate projections condense information from multiple climate models, using multiple greenhouse gas emission pathways (e.g. Representative Concentration Pathways) to characterize different yet coherent climate futures. Such a product highlights plausible climatic changes through the use of narratives, graphs, maps, and perhaps raw data. Climate projections are often publicly available for policy-makers, public and private decision makers, as well as researchers to undertake further climate impact studies, risk assessments, and climate change adaptation research. The projections are updated every few years, in order to incorporate new scientific insights and improved climate models.
Aims[edit]
National climate projections illustrate plausible changes to a country’s climate in the future. By using multiple emission scenarios, these projections highlight the impact different global mitigation efforts have on variables, including temperature, precipitation, and sunshine hours. Climate scientists strongly recommend the use of multiple emission scenarios in order to ensure that decisions are robust to a range of climatic changes. National climate projections form the basis of national climate adaptation and climate resilience plans, which are reported to UNFCCC and used in IPCC assessments.
Design[edit]
To explore a wide range of plausible climatic outcomes and to enhance confidence in the projections, national climate change projections are often generated from multiple general circulation models (GCMs). Such climate ensembles can take the form of perturbed physics ensembles (PPE), multi-model ensembles (MME), or initial condition ensembles (ICE).[24] As the spatial resolution of the underlying GCMs is typically quite coarse, the projections are often downscaled, either dynamically using regional climate models (RCMs), or statistically. Some projections include data from areas which are larger than the national boundaries, e.g. to more fully evaluate catchment areas of transboundary rivers. Some countries have also produced more localized projections for smaller administrative areas, e.g. States in the United States, and Länder in Germany.
Various countries have produced their national climate projections with feedback and/or interaction with stakeholders.[25] Such engagement efforts have helped tailoring the climate information to the stakeholders’ needs, including the provision of sector-specific climate indicators such as degree-heating days. In the past, engagement formats have included surveys, interviews, presentations, workshops, and use-cases. While such interactions helped not only to enhance the usability of the climate information, it also fostered discussions on how to use climate information in adaptation projects. Interestingly, a comparison of the British, Dutch, and Swiss climate projections revealed distinct national preferences in the way stakeholders were engaged, as well as how the climate model outputs were condensed and communicated.[25]
Examples[edit]
Over 30 countries have reported national climate projections / scenarios in their most recent National Communications to United Nations Framework Convention on Climate Change. Many European governments have also funded national information portals on climate change.[26]
- Australia: CCIA[27]
- California: Cal-Adapt[28]
- Netherlands: KNMI’14[29]
- Switzerland: CH2011[30] / CH2018[31]
- UK: UKCP09 / UKCP18[32][33]
For countries which lack adequate resources to develop their own climate change projections, organisations such as UNDP or FAO have sponsored development of projections and national adaptation programmes (NAPAs).[34][35]
Applications[edit]
National climate projections are widely used to predict climate change impacts in a wide range of economic sectors, and also to inform climate change adaptation studies and decisions. Some examples include:
- Energy[36]
- Water[37]
- Agriculture and forestry:[38][39] effects of climate change on agriculture
- Fisheries
- Ecosystems and Biodiversity:[40] effects of climate change on oceans, effects of climate change on terrestrial animals, effects of climate change on plant biodiversity
- Health:[41] effects of climate change on human health
- Transport[42]
- Coastal areas[43]
- Tourism[44]
- Insurance[45]
- Infrastructure[46]
- Cities and urban environments[47]
- Disaster risk[48]
- Human migration (across many nations and relevant to nations’ border control, migration policies and climate adaptation)[49]
Comparisons[edit]
A detailed comparison between some national climate projections have been carried out.[25][50]
Global long-term scenarios[edit]
In 2021, researchers who found that projecting effects of greenhouse gas emissions only for up to 2100, as widely practiced in research and policy-making, is short-sighted modeled RCPs climate change scenarios and their effects for up to 2500.[51][52]
Projections for crop suitability to 2100 and 2500 under the moderate–high RCP6.0 emission scenario
Global mean near-surface air temperature and thermosteric sea-level rise anomalies relative to the 2000–2019 mean for RCP scenarios
Mean number of months per year where heat stress exceeds 38°C (UTCI scale) in present (2020) and future climates
Being able to reduce greenhouse gas emissions will require many major transitions: including massive reduction of fossil fuels, producing and distributing low-emission energy sources, changing to various other energy providers, and, maybe most important, conserving energy and being more efficient with it. If fossil fuels continue to be burnt and vented to the environment, GHG emissions will be very hard to reduce.[53]
Mitigation scenarios[edit]
Scenarios of global greenhouse gas emissions. If all countries achieve their current Paris Agreement pledges, average warming by 2100 will go far beyond the target of the Paris Agreement to keep warming «well below 2°C».
Climate change mitigation scenarios are possible futures in which global warming is reduced by deliberate actions, such as a comprehensive switch to energy sources other than fossil fuels. These are actions that minimize emissions so atmospheric greenhouse gas concentrations are stabilized at levels that restrict the adverse consequences of climate change. Using these scenarios, the examination of the impacts of different carbon prices on an economy is enabled within the framework of different levels of global aspirations.[54]
A typical mitigation scenario is constructed by selecting a long-range target, such as a desired atmospheric concentration of carbon dioxide (CO2), and then fitting the actions to the target, for example by placing a cap on net global and national emissions of greenhouse gases.
An increase of global temperature by more than 2 °C has come to be the majority definition of what would constitute intolerably dangerous climate change with efforts to limit the temperature increase to 1.5 °C above pre-industrial levels per the Paris Agreement. Some climate scientists are increasingly of the opinion that the goal should be a complete restoration of the atmosphere’s preindustrial condition, on the grounds that too protracted a deviation from those conditions will produce irreversible changes.[citation needed]
Stabilization wedges[edit]
A stabilization wedge (or simply «wedge») is an action which incrementally reduces projected emissions. The name is derived from the triangular shape of the gap between reduced and unreduced emissions trajectories when graphed over time. For example, a reduction in electricity demand due to increased efficiency means that less electricity needs to be generated and thus fewer emissions need to be produced. The term originates in the Stabilization Wedge Game. As a reference unit, a stabilization wedge is equal to the following examples of mitigation initiatives: deployment of two hundred thousand 10 MW wind turbines; completely halting the deforestation and planting of 300 million hectares of trees; the increase in the average energy efficiency of all the world’s buildings by 25 percent;[when?] or the installation of carbon capture and storage facilities in 800 large coal-fired power plants.[55] Pacala and Socolow proposed in their work, Stabilization Wedges, that seven wedges are required to be delivered by 2050 – at current technologies – to make a significant impact on the mitigation of climate change.[56] There are, however, sources that estimate the need for 14 wedges because Pacala and Socolow’s proposal would only stabilize carbon dioxide emissions at current levels but not the atmospheric concentration, which is increasing by more than 2 ppm/year.[55] In 2011, Socolow revised their earlier estimate to nine.[57]
Target levels of CO2[edit]
Contributions to climate change, whether they cool or warm the Earth, are often described in terms of the radiative forcing or imbalance they introduce to the planet’s energy budget. Now and in the future, anthropogenic carbon dioxide is believed to be the major component of this forcing, and the contribution of other components is often quantified in terms of «parts-per-million carbon dioxide equivalent» (ppm CO2e), or the increment/decrement in carbon dioxide concentrations which would create a radiative forcing of the same magnitude.
450 ppm[edit]
The BLUE scenarios in the IEA’s Energy Technology Perspectives publication of 2008 describe pathways to a long-range concentration of 450 ppm. Joseph Romm has sketched how to achieve this target through the application of 14 wedges.[58]
World Energy Outlook 2008, mentioned above, also describes a «450 Policy Scenario», in which extra energy investments to 2030 amount to $9.3 trillion over the Reference Scenario. The scenario also features, after 2020, the participation of major economies such as China and India in a global cap-and-trade scheme initially operating in OECD and European Union countries. Also the less conservative 450 ppm scenario calls for extensive deployment of negative emissions, i.e. the removal of CO2 from the atmosphere. According to the International Energy Agency (IEA) and OECD, «Achieving lower concentration targets (450 ppm) depends significantly on the use of BECCS».[59]
550 ppm[edit]
This is the target advocated (as an upper bound) in the Stern Review. As approximately a doubling of CO2 levels relative to preindustrial times, it implies a temperature increase of about three degrees, according to conventional estimates of climate sensitivity. Pacala and Socolow list 15 «wedges», any 7 of which in combination should suffice to keep CO2 levels below 550 ppm.[60]
The International Energy Agency’s World Energy Outlook report for 2008 describes a «Reference Scenario» for the world’s energy future «which assumes no new government policies beyond those already adopted by mid-2008», and then a «550 Policy Scenario» in which further policies are adopted, a mixture of «cap-and-trade systems, sectoral agreements and national measures». In the Reference Scenario, between 2006 and 2030 the world invests $26.3 trillion in energy-supply infrastructure; in the 550 Policy Scenario, a further $4.1 trillion is spent in this period, mostly on efficiency increases which deliver fuel cost savings of over $7 trillion.[61]
Other greenhouse gases[edit]
Greenhouse gas concentrations are aggregated in terms of carbon dioxide equivalent. Some multi-gas mitigation scenarios have been modeled by Meinshausen et al.[62]
As a short-term focus[edit]
In a 2000 paper,[63] Hansen argued that the 0.75 °C[failed verification] rise in average global temperatures over the last 100 years has been driven mainly by greenhouse gases other than carbon dioxide, since warming due to CO2 had been offset by cooling due to aerosols, implying the viability of a strategy initially based around reducing emissions of non-CO2 greenhouse gases and of black carbon, focusing on CO2 only in the longer run.[64]
This was also argued by Veerabhadran Ramanathan and Jessica Seddon Wallack in the September/October 2009 Foreign Affairs.[65]
See also[edit]
- 4 Degrees and Beyond International Climate Conference
- Bio-energy with carbon capture and storage (BECCS)
- Carbon dioxide removal (CDR)
- Carbon negative fuel
- Climate engineering (geoengineering)
- Emissions trading
- Energy modeling
- Virgin Earth Challenge
- Drawdown (climate)
- CMIP
- Copernicus Programme
- Ensemble forecasting
- Sensitivity analysis
- Uncertainty analysis
- Scenario planning
References[edit]
- ^ Carter, T.R.; et al. (2001). «Developing and Applying Scenarios. In: Climate Change 2001: Impacts, Adaptation and Vulnerability. Contribution of Working Group II to the Third Assessment Report of the Intergovernmental Panel on Climate Change [J.J. McCarthy et al. Eds.]». Cambridge University Press, Cambridge, U.K., and New York, N.Y., U.S.A. Archived from the original on 2018-10-05. Retrieved 2010-01-10.
- ^ a b «IPCC AR6 WG3 Ch3» (PDF).
- ^ Press release: Special Report on Global Warming of 1.5ºC (PDF) (Report). Incheon, Republic of Korea: Intergovernmental Panel on Climate Change (IPCC). 8 October 2018. Retrieved 7 October 2018.
- ^ Morita, T.; et al. (2001). «Greenhouse Gas Emission Mitigation Scenarios and Implications. In: Climate Change 2001: Mitigation. Contribution of Working Group III to the Third Assessment Report of the Intergovernmental Panel on Climate Change [B. Metz et al. Eds.]». Cambridge University Press, Cambridge, U.K., and New York, N.Y., U.S.A. Archived from the original on 2018-10-05. Retrieved 2010-01-10.
- ^ Fisher, B.S.; et al. (2007). «Issues related to mitigation in the long term context. In: Climate Change 2007: Mitigation. Contribution of Working Group III to the Fourth Assessment Report of the Intergovernmental Panel on Climate Change [B. Metz et al. Eds.]». Cambridge University Press, Cambridge, U.K., and New York, N.Y., U.S.A. Archived from the original on 2018-10-05. Retrieved 2009-05-20.
- ^ IPCC (2007c). «Annex. In: Climate Change 2007: Mitigation. Contribution of Working Group III to the Fourth Assessment Report of the Intergovernmental Panel on Climate Change [B. Metz et al. Eds.]». Cambridge University Press, Cambridge, U.K., and New York, N.Y., U.S.A. Archived from the original on 2018-10-05. Retrieved 2009-05-20.
- ^ «Using the Clean Air Act to Sharply Reduce Carbon Pollution from Existing Power Plants». Natural Resources Defense Counsel. Retrieved October 9, 2013.
- ^ Rogner, H.-H.; et al. (2007). «Introduction. In: Climate Change 2007: Mitigation. Contribution of Working Group III to the Fourth Assessment Report of the Intergovernmental Panel on Climate Change [B. Metz et al. Eds.]». Cambridge University Press, Cambridge, U.K., and New York, N.Y., U.S.A. Archived from the original on 2018-10-05. Retrieved 2009-05-20.
- ^ Fisher, B.S.; et al. (2007). ««3.2.1.6 Land-use change and land-use management.» In [book chapter]: «Issues related to mitigation in the long term context.» In [book]: «Climate Change 2007: Mitigation. Contribution of Working Group III to the Fourth Assessment Report of the Intergovernmental Panel on Climate Change [B. Metz et al. Eds.]». Print version: Cambridge University Press, Cambridge, U.K., and New York, N.Y., U.S.A.. This version: IPCC website. Archived from the original on 2010-04-25. Retrieved 2010-03-18.
- ^ Fisher; et al., «Chapter 3: Issues related to mitigation in the long-term context», Archived copy, Sec. 3.1 Emissions scenarios, archived from the original on 2018-11-16, retrieved 2012-09-08
{{citation}}: CS1 maint: archived copy as title (link), in IPCC AR4 WG3 2007 - ^ Morita; et al., «Chapter 2, Greenhouse Gas Emission Mitigation Scenarios and Implications», Archived copy, Sec. 2.5.1.1 IPCC Emissions Scenarios and the SRES Process, archived from the original on 2013-07-06, retrieved 2012-09-08
{{citation}}: CS1 maint: archived copy as title (link), in IPCC TAR WG3 2001. - ^
Karl, TR; et al., eds. (2009), «Global climate change», Global Climate Change Impacts in the United States, New York, NY, USA: Cambridge University Press, p. 22, ISBN 978-0-521-14407-0, archived from the original on 2012-09-15 - ^
Rogner, H.-H.; et al., «Introduction», Sec 1.3.2 Future outlook , in IPCC AR4 WG3 2007 - ^ IEA (2004). World Energy Outlook 2004 (PDF). World Energy Outlook website. p. 74.
- ^ Section 4.3.1, Fossil fuels Archived 2012-09-10 at the Wayback Machine, in IPCC AR4 WG3 2007.
- ^ Section 4.4.1, Carbon dioxide emissions from energy supply by 2030 Archived 2012-09-10 at the Wayback Machine, in IPCC AR4 WG3 2007.
- ^ Garnaut, R.; Howes, S.; Jotzo, F.; Sheehan, P. (2008). «Emissions in the Platinum Age: the implications of rapid development for climate-change mitigation» (PDF). Oxford Review of Economic Policy. 24 (2): 392. doi:10.1093/oxrep/grn021. Archived from the original (PDF) on 2012-03-21. Retrieved 2012-09-08.
- ^ a b
International Energy Agency (IEA) (2011), World Energy Outlook 2011: Fact Sheets (PDF), Paris, France: IEA, p. 2, ISBN 978-92-64-12413-4 - ^ a b c d e
UNEP (November 2011), Bridging the Emissions Gap: A UNEP Synthesis Report (PDF), Nairobi, Kenya: United Nations Environment Programme (UNEP), ISBN 978-92-807-3229-0 UNEP Stock Number: DEW/1470/NA - ^ Fozzard, Adrian (2014). Climate Change Public Expenditure and Institutional Review Sourcebook (CCPEIR). Washington, D.C.: World Bank Publications. p. 92.
- ^ Alam, Shawkat; Bhuiyan, Jahid; Chowdhury, Tareq; Techera, Erika (2013). Routledge Handbook of International Environmental Law. London: Routledge. p. 373. ISBN 9780415687171.
- ^ Govaere, Inge; Poli, Sara (2014). EU Management of Global Emergencies: Legal Framework for Combating Threats and Crises. Leiden: BRILL Nijhoff. p. 313. ISBN 9789004268326.
- ^ van Drunen, M.A.; Lasage, R.; Dorland, C. (2006). Climate Change in Developing Countries: Results from the Netherlands Climate Change Studies Assistance Programme. Cambridge, MA: CAB International. p. 52. ISBN 9781845930776.
- ^ Parker, Wendy S. (2012). «Whose Probabilities? Predicting Climate Change with Ensembles of Models». Philosophy of Science. 77 (5): 985–997. doi:10.1086/656815. ISSN 0031-8248. S2CID 121314681.
- ^ a b c Skelton, Maurice; Porter, James J.; Dessai, Suraje; Bresch, David N.; Knutti, Reto (2017-04-26). «The social and scientific values that shape national climate scenarios: a comparison of the Netherlands, Switzerland and the UK». Regional Environmental Change. 17 (8): 2325–2338. doi:10.1007/s10113-017-1155-z. ISSN 1436-3798. PMC 6959399. PMID 32009852.
- ^
Füssel, Hans-Martin (2014). How Is Uncertainty Addressed in the Knowledge Base for National Adaptation Planning?. In Adapting to an Uncertain Climate. pp. 41-66: Springer, Cham. ISBN 978-3-319-04875-8.{{cite book}}: CS1 maint: location (link) - ^ Climate Change in Australia
- ^ California climate change scenarios and climate impact research
- ^ KNMI’14 Pictures of the future — Climate scenarios
- ^ «Swiss Climate Change Scenarios CH2011 B». ch2011.ch. Retrieved 2018-08-23.
- ^ CH2018 — New Climate Scenarios for Switzerland
- ^ UKCP18 Project announcement
- ^ UKCP18 Demonstration Projects (Met Office)
- ^ UNDP — Supporting Integrated Climate Change Strategies
- ^ UNFCCC — National Adaptation Programmes of Action — Introduction
- ^ European Climatic Energy Mixes (ECEM)
- ^ California’s Climate Adaptation Strategy for Water
- ^ Climate-ADAPT EU sector policies — Agriculture
- ^ Switzerland: Climate change impacts on tree species, forest properties, and ecosystem services
- ^ BACC – The Baltex Assessment of Climate Change for the Baltic Sea basin
- ^ «Health effects of climate change in the UK 2012». Archived from the original on 2013-11-04. Retrieved 2021-03-14.
- ^ UK’s Climate change national adaptation programme: transport
- ^ «The Netherland’s Delta Programme 2018 — Continuing the work on a sustainable and safe delta» (PDF). Archived from the original (PDF) on 2018-11-05. Retrieved 2021-03-14.
- ^ Copernicus climate data boosts Europe’s tourism sector[permanent dead link]
- ^ «SwissRe: The Economics of Climate Adaptation». Archived from the original on 2018-11-06. Retrieved 2021-03-14.
- ^ Infrastructure, Engineering and Climate Change Adaptation – ensuring services in an uncertain future
- ^ Australia’s National Climate Resilience and Adaptation Strategy
- ^ UNISDR -Coherence and mutual reinforcement between the Sendai Framework for Disaster Risk Reduction 2015-2030 and international agreements for development and climate action
- ^ «Future of the human climate niche» (PDF). Archived (PDF) from the original on 14 May 2020. Retrieved 25 June 2020.
- ^ National climate change vulnerability and risk assessments in Europe, 2018
- ^ «By 2500 earth could be alien to humans». Scienmag: Latest Science and Health News. 14 October 2021. Retrieved 18 October 2021.
- ^ Lyon, Christopher; Saupe, Erin E.; Smith, Christopher J.; Hill, Daniel J.; Beckerman, Andrew P.; Stringer, Lindsay C.; Marchant, Robert; McKay, James; Burke, Ariane; O’Higgins, Paul; Dunhill, Alexander M.; Allen, Bethany J.; Riel-Salvatore, Julien; Aze, Tracy (2021). «Climate change research and action must look beyond 2100». Global Change Biology. 28 (2): 349–361. doi:10.1111/gcb.15871. ISSN 1365-2486. PMID 34558764. S2CID 237616583.
- ^ «WGII Summary for Policymakers Headline Statements».
- ^ Commonwealth of Australia, “Climate Change Mitigation Scenarios: Modeling report provided to the Climate Change Authority in support of its Caps and Targets Review,” 2013. Retrieved 13 December 2018 from https://www.environment.gov.au/system/files/resources/a28424ae-cce9-48c9-aad2-56b3db0920a5/files/climate-change-mitigation-scenarios.pdf
- ^ a b Dawson, Brian; Spannagle, Matt (2008). The Complete Guide to Climate Change. Oxon: Routledge. pp. 283. ISBN 978-0415477895.
- ^ Pacala, S.; Socolow, R. (2004-08-13). «Stabilization Wedges: Solving the Climate Problem for the Next 50 Years with Current Technologies». Science. 305 (5686): 968–972. Bibcode:2004Sci…305..968P. CiteSeerX 10.1.1.642.8472. doi:10.1126/science.1100103. ISSN 0036-8075. PMID 15310891. S2CID 2203046.
- ^ Socolow, Robert (September 27, 2011). «Wedges reaffirmed — Bulletin of the Atomic Scientists». Bulletin of the Atomic Scientists. Retrieved 2018-08-27.
- ^ Is 450 ppm (or less) politically possible? Part 2: The Solution
- ^ «OECD Environmental Outlook to 2050, Climate Change Chapter, pre-release version» (PDF). OECD. 2011. Retrieved 2012-01-16.
- ^ Pacala, S.; Socolow, R. (13 August 2004). «Stabilization Wedges: Solving the Climate Problem for the Next 50 Years with Current Technologies». Science. 305 (5686): 968–972. Bibcode:2004Sci…305..968P. CiteSeerX 10.1.1.642.8472. doi:10.1126/science.1100103. PMID 15310891. S2CID 2203046.
- ^ http://www.iea.org/weo/docs/weo2008/fact_sheets_08.pdf Archived 2008-11-17 at the Wayback Machine World Energy Outlook 2008 Fact Sheet
- ^ Meinshausen, M.; Hare, B.; Wigley, T. M. M.; Vuuren, D.; Elzen, M. G. J.; Swart, R. (2006). «Multi-gas Emissions Pathways to Meet Climate Targets» (PDF). Climatic Change. 75 (1–2): 151. Bibcode:2006ClCh…75..151M. doi:10.1007/s10584-005-9013-2. hdl:20.500.11850/36894. S2CID 55462579.
- ^ Hansen, James; Sato, Makiko; Ruedy, Reto; Lacis, Andrew; Oinas, Valdar (29 August 2000). «Global warming in the twenty-first century: An alternative scenario». Proceedings of the National Academy of Sciences. 97 (18): 9875–9880. Bibcode:2000PNAS…97.9875H. doi:10.1073/pnas.170278997. PMC 27611. PMID 10944197.
- ^ Review of Hansen et al.: Global Warming in the Twenty-First Century: An Alternative Scenario[permanent dead link]
- ^ Why Black Carbon and Ozone Also Matter
- IPCC TAR WG3 (2001), Metz, B.; Davidson, O.; Swart, R.; Pan, J. (eds.), Climate Change 2001: Mitigation, Contribution of Working Group III to the Third Assessment Report of the Intergovernmental Panel on Climate Change, Cambridge University Press, ISBN 0-521-80769-7, archived from the original on 2017-02-27 (pb: 0-521-01502-2).
- IPCC AR4 WG3 (2007), Metz, B.; Davidson, O.R.; Bosch, P.R.; Dave, R.; Meyer, L.A. (eds.), Climate Change 2007: Mitigation of Climate Change, Contribution of Working Group III to the Fourth Assessment Report of the Intergovernmental Panel on Climate Change, Cambridge University Press, ISBN 978-0-521-88011-4, archived from the original on 2014-10-12, retrieved 2012-09-08 (pb: 978-0-521-70598-1).
External links[edit]
- National climate change vulnerability and risk assessments in Europe, 2018
- Climate-ADAPT portal (large selection of European studies using national climate projections)
- UNDP Climate Change Country Profiles — Introduction;UNDP Climate Change Country Profiles (61 countries)
Повышение температуры Земли на 2,5 градуса может привести к таянию ледников, что вызовет подъем уровня воды и затопление прибрежных территорий. Об этом «Известиям» 27 октября рассказал доцент Института экологии РУДН Владимир Пинаев.
Накануне был опубликован доклад Рамочной конвенции ООН об изменении климата (РКИК), согласно которому человечеству не удастся, как планировалось ранее, удержать глобальное потепление в пределах 1,5 градуса Цельсия до 2100 года. Так, специалисты полагают, что к концу столетия температура на планете повысится примерно на 2,5 градуса.
«Существует две точки зрения. Первая — что человечество никак не может повлиять на изменение климата, потому что Земля — это очень большая и очень инерционная система. Даже если сейчас все производства остановят, температура все равно будет подниматься. И вторая точка зрения — давайте сейчас остановим всю промышленность и попытаемся предотвратить потепление. Существуют разные модели и разные расчеты. До 2100 года еще 80 лет. И что там на самом деле будет, никто не знает», — пояснил Пинаев.
Однако он подчеркнул, что человечеству, конечно, следует предпринимать какие-то действия для снижения рисков, например сажать леса и сокращать выбросы.
«Но не так, что все заводы под ключ, а коров под нож, потому что, даже если мы это реализуем, вполне возможно, что за такой относительно короткий промежуток времени кардинальных изменений не произойдет», — указал эколог.
По его словам, повышение температуры на 2,5 градуса может привести к таянию ледников, что вызовет подъем уровня воды и затопление прибрежных территорий.
«Но это произойдет, если люди ничего не будут с этим делать. Если они будут реагировать, как, например, строительство дамб в Нидерландах, то ничего опасного не случится. Однако, чтобы следить за этими процессами, необходима система мониторинга», — уточнил Пинаев.
Специалист отметил, что жители планеты, вероятно, не заметят повышения температуры 2,5 градуса, поскольку бывают и более теплые, и более холодные сезоны. В целом для решения проблемы глобального климата важна система мониторинга и реагирования на ЧС, резюмировал эксперт.
В июле климатолог, научный руководитель Института глобального климата и экологии имени академика Ю.А. Израэля Сергей Семенов предупредил, что, если человечество продолжит безответственно относиться к вопросам глобального климата, в мире могут появиться новые регионы с дефицитом воды вплоть до опустынивания. Так, в зоне риска находятся Северная Африка, Южная Америка, юго-запад США. При этом в России подобные явления также возможны: в зоне риска —южные территории.
По словам специалиста, более благоприятная ситуация возможна, в случае если человечество будет активно переходить на возобновляемые источники энергии, экономить топливо, а также укреплять региональное сотрудничество в этой области.