Запись тестовых сценариев при помощи JMeter
20 февраля, 2016 12:01 пп
9 735 views
| Комментариев нет
Java
Данное руководство научит использовать рекордер тестовых скриптов Apache JMeter для записи HTTP-запросов. Это позволяет планировать тестирование и эмулировать поведение пользователей в сети.
Примечание: Данное руководство предполагает наличие базовых навыков работы с Apache JMeter. Об основных принципах работы данного инструмента можно прочесть здесь.
Требования
- Предварительно установленный Apache JMeter (скачать бинарные файлы можно здесь).
- Java 6+.
- Mozilla Firefox (можно загрузить по этой ссылке).
При написании руководства использовались следующие версии программ:
- Oracle Java 7
- JMeter 2.11
- Firefox 30.0
Создание теста
Для начала запустите JMeter.
Примечание: Если у вас уже есть готовый план тестирования, используйте его и пропустите данный раздел.
Создайте минимальную группу потоков, состоящую из компонентов Thread Group и HTTP Request Defaults.
Добавление группы потоков
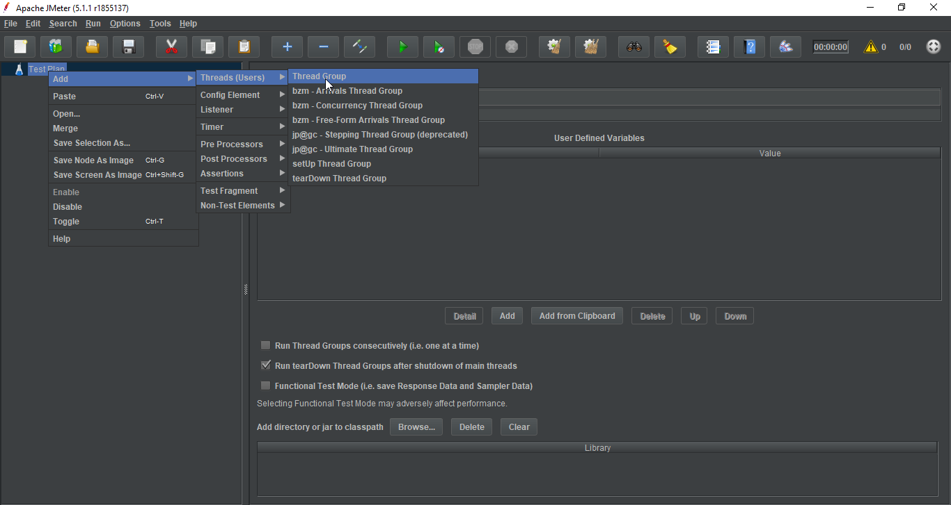
Чтобы добавить Thread Group):
- Щелкните правой кнопкой по Test Plan
- Выберите Add >
- Найдите и выберите Threads (Users) >
- Выберите Thread Group
Установите следующие значения параметров Thread Group:
- Number of Threads (users): Количество потоков (пользователей), которое будет эмулировать JMeter; установите значение 50.
- Ramp-Up Period (in seconds): Продолжительность тестирования в секундах. Установите значение 10
- Loop Count: Количество тестов. Установите 1.
Добавление настроек HTTP
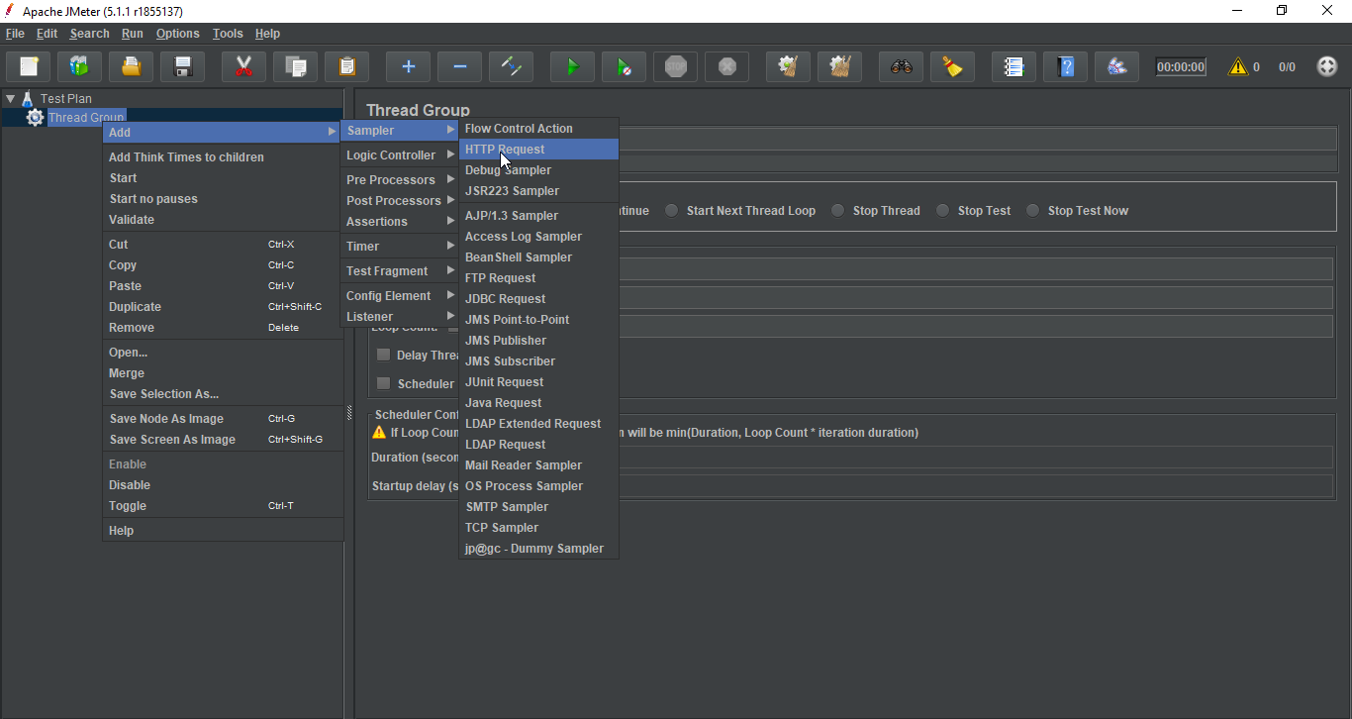
Чтобы добавить HTTP Request Defaults для Thread Group:
- Кликните правой кнопкой на Thread Group.
- Нажмите Add.
- Затем выберите Config Element >.
- Кликните HTTP Request Defaults.
На экране появятся настройки для HTTP Request Defaults. В разделе Web Server найдите поле Server Name or IP и укажите в нём имя или IP-адрес веб-сервера, который нужно протестировать. Установленный здесь сервер становится сервером по умолчанию для остальных элементов этой группы потоков.
Добавление HTTP Cookie Manager
Если сервер использует cookie-файлы, можно настроить их поддержку при помощи элемента HTTP Cookie Manager. Чтобы добавить в Thread Group элемент HTTP Cookie Manager:
- Кликните правой кнопкой на Thread Group.
- Нажмите Add >.
- Затем выберите Config Element >.
- Кликните HTTP Cookie Manager.
Добавление компонента Recording Controller
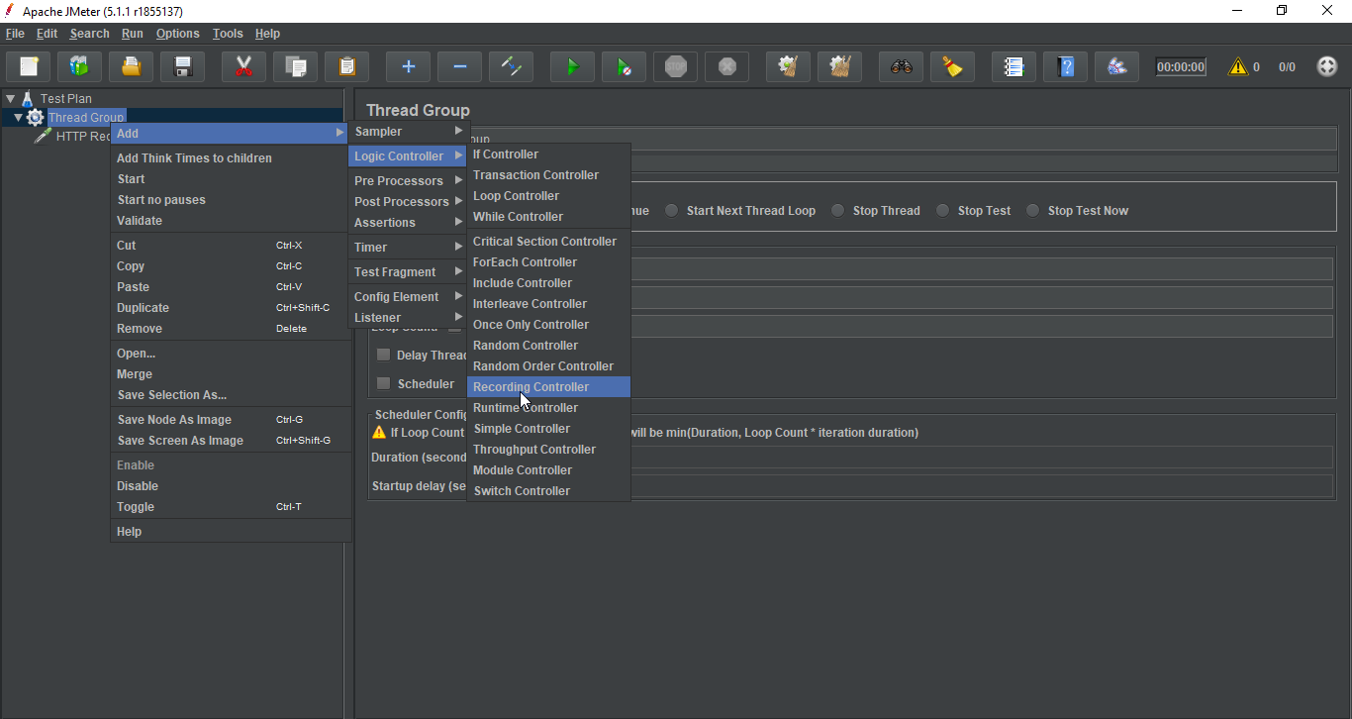
Чтобы добавить компонент Recording Controller:
- Кликните правой кнопкой на Thread Group.
- Нажмите Add >.
- Выберите Logic Controller >.
- Кликните HTTP Recording Controller.
Компонент Recording Controller создаёт семплеры HTTP Request.
Добавление компонента HTTP(S) Test Script Recorder
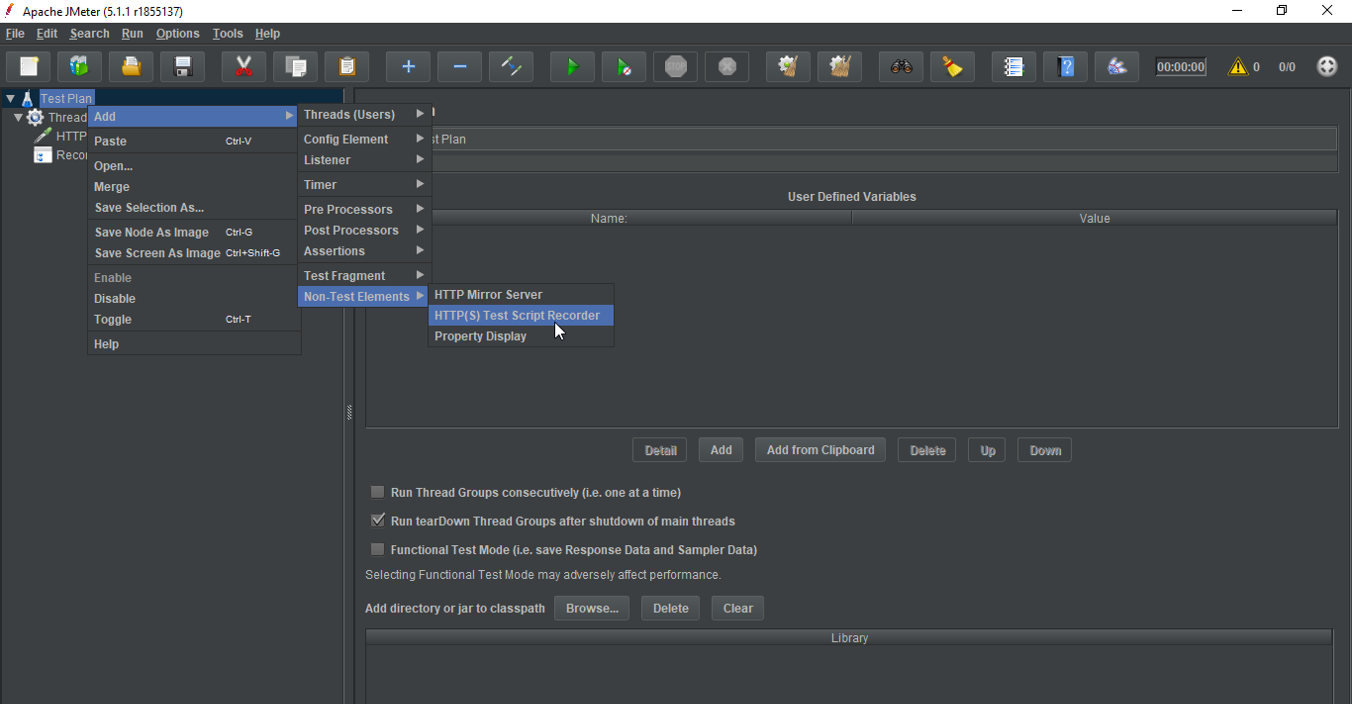
Теперь нужно добавить компонент HTTP(S) Test Script Recorder в WorkBench:
- Выберите WorkBench и кликните правой кнопкой мыши.
- Нажмите Add >.
- Выберите Non-Test Elements >.
- Нажмите HTTP(S) Test Script Recorder.
Примечание: Компоненты, которые добавляются в WorkBench, не сохраняются вместе с остальными компонентами плана. Чтобы сохранить компоненты WorkBench, кликните на WorkBench правой кнопкой и выберите Save Selection As… Сохранив компоненты, можете добавить их в план тестирования; для этого откройте меню, нажмите Merge и выберите сохранённые компоненты WorkBench.
Настройка портов
Стандартный порт прокси HTTP(S) Test Script Recorder – 8080. Его можно изменить в глобальных настройках (Global Settings, параметр Port).
Шаблоны URL (опционально)
HTTP(S) Script Recorder позволяет добавлять шаблоны, URL Patterns, написанные как регулярные выражения. Они позволяют включить в запись и исключить из неё некоторые компоненты. Многие рекомендуют включать в запись только тип запрашиваемого контента (*.html, *.php, и т.п.) или исключать из записи типы контента, который запрашивать не нужно (к примеру, *.jpg, *.png, *.js).
Чтобы добавить шаблон:
- Откройте раздел URL Patterns to Include или URL Patterns to Exclude;
- Нажмите Add;
- Введите шаблон.
Примечание: чтобы добавить больше шаблонов, просто повторите описанные выше действия.
Примеры:
- URL Patterns дл веб-страниц:
.*.html

.*.php

.*.htm
- URL Patterns для изображений:
.*.png

.*.jpg

.*.gif
Добавление компонентов в Script Recorder (опционально)
Чтобы записанные запросы наследовали какие-либо компоненты, нужно добавить эти компоненты в HTTP(S) Test Script Recorder. К примеру, если добавить в Script Recorder компонент Timer, то этот компонент будет добавлен в каждый запрос (HTTP Request). Этот компонент создаёт очередь потоков, ожидающих выполнения запроса.
Чтобы добавить Constant Timer в HTTP(S) Test Script Recorder:
- Выберите HTTP(S) Test Script Recorder и кликните правой кнопкой мыши.
- Нажмите Add >.
- Выберите Timers >.
- Нажмите Constant Timer.
Настроить ожидание потока можно по своему усмотрению.
Предположим, вы хотите эмулировать клики пользователей на разных страницах каждые 2 секунды; для этого нужно установить ожидание потока в 2000 миллисекунд.
Запись тестирования
Нажмите кнопку Start в окне Script Recorder, чтобы запустить прокси-сервер JMeter, который будет перехватывать и записывать запросы к браузеру.
При первом запуске Script Recorder вернёт ошибку, сообщив, что он не может запуститься, поскольку нет сертификата. Просто нажмите OK, после чего инструмент запустится во второй раз. На экране появится сообщение о том, что в каталоге bin инструмент JMeter создал временный сертификат ApacheJMeterTemporaryRootCA.crt. чтобы продолжить, нажмите OK.
Примечание: Если браузер уже использует прокси-сервер, то нужно настроить JMeter для использования этого сервера ещё до запуска. Для этого существуют параметры -H и –P.
Настройка браузера для использования прокси-сервера JMeter
В данном руководстве используется браузер Firefox. В отличие от Chrome и некоторых других браузеров, он позволяет ппрокси-серверам переопределять общесистемные настройки.
Настройте Firefox для использования локального хоста (127.0.0.1) на порте 8080 в качестве прокси-сервера для всего трафика:
- Откройте Firefox;
- Найдите меню Preferences;
- Кликните в нём по вкладке Advanced;
- Откройте вкладку Network;
- В разделе Connection кликните «Settings…»;
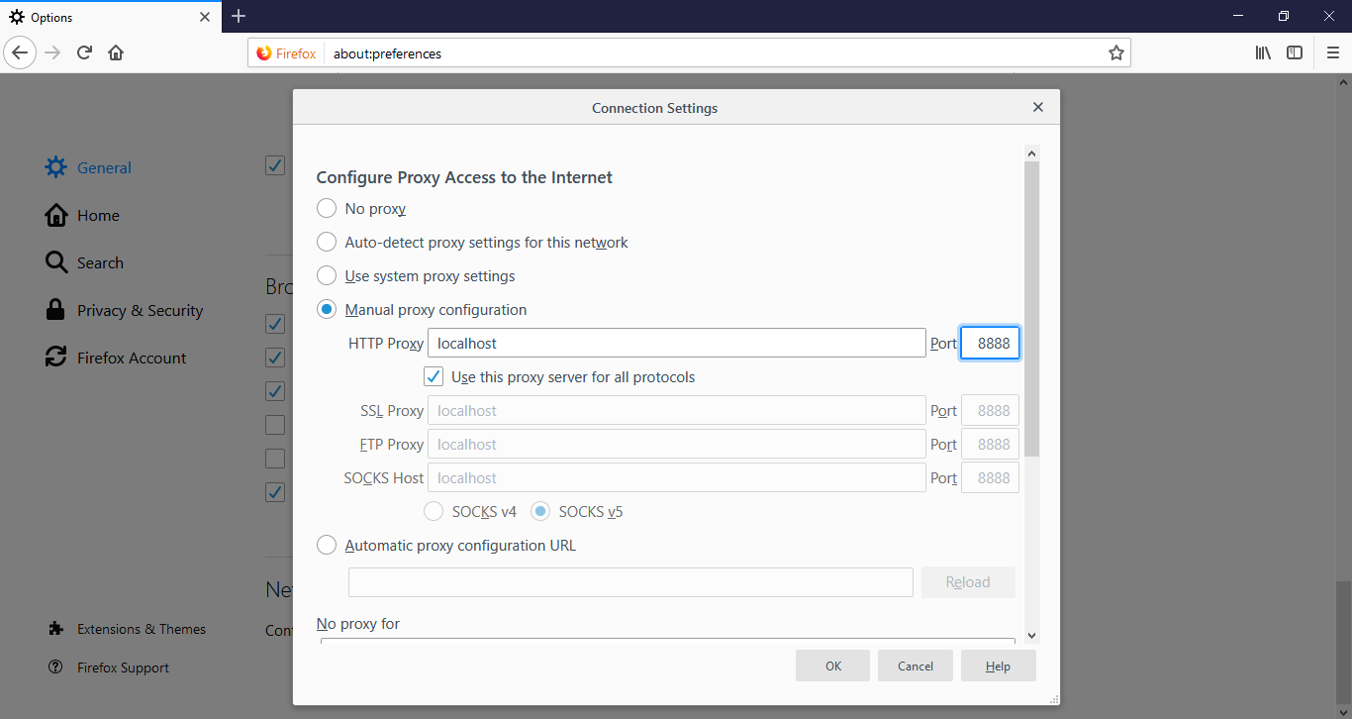
- Нажмите Manual proxy configuration;
- В HTTP Proxy укажите localhost, а в Port – 8080;
- Нажмите OK и закройте меню Preferences.
Примечание: Если браузер Firefox настроен для поддержки прокси-сервера JMeter для Script Recorder, он будет работать корректно только тогда, когда запущен Script Recorder.
Запись запросов HTTP
Теперь, когда HTTP(S) Test Script Recorder запущен, а Firefox настроен для поддержки его прокси-сервера, все HTTP-запросы браузера будут записаны.
Убедитесь, что всё работает должным образом.
В браузере Firefox откройте домашнюю страницу сервера, указанного в HTTP Request Defaults.
http://your_domain.com/
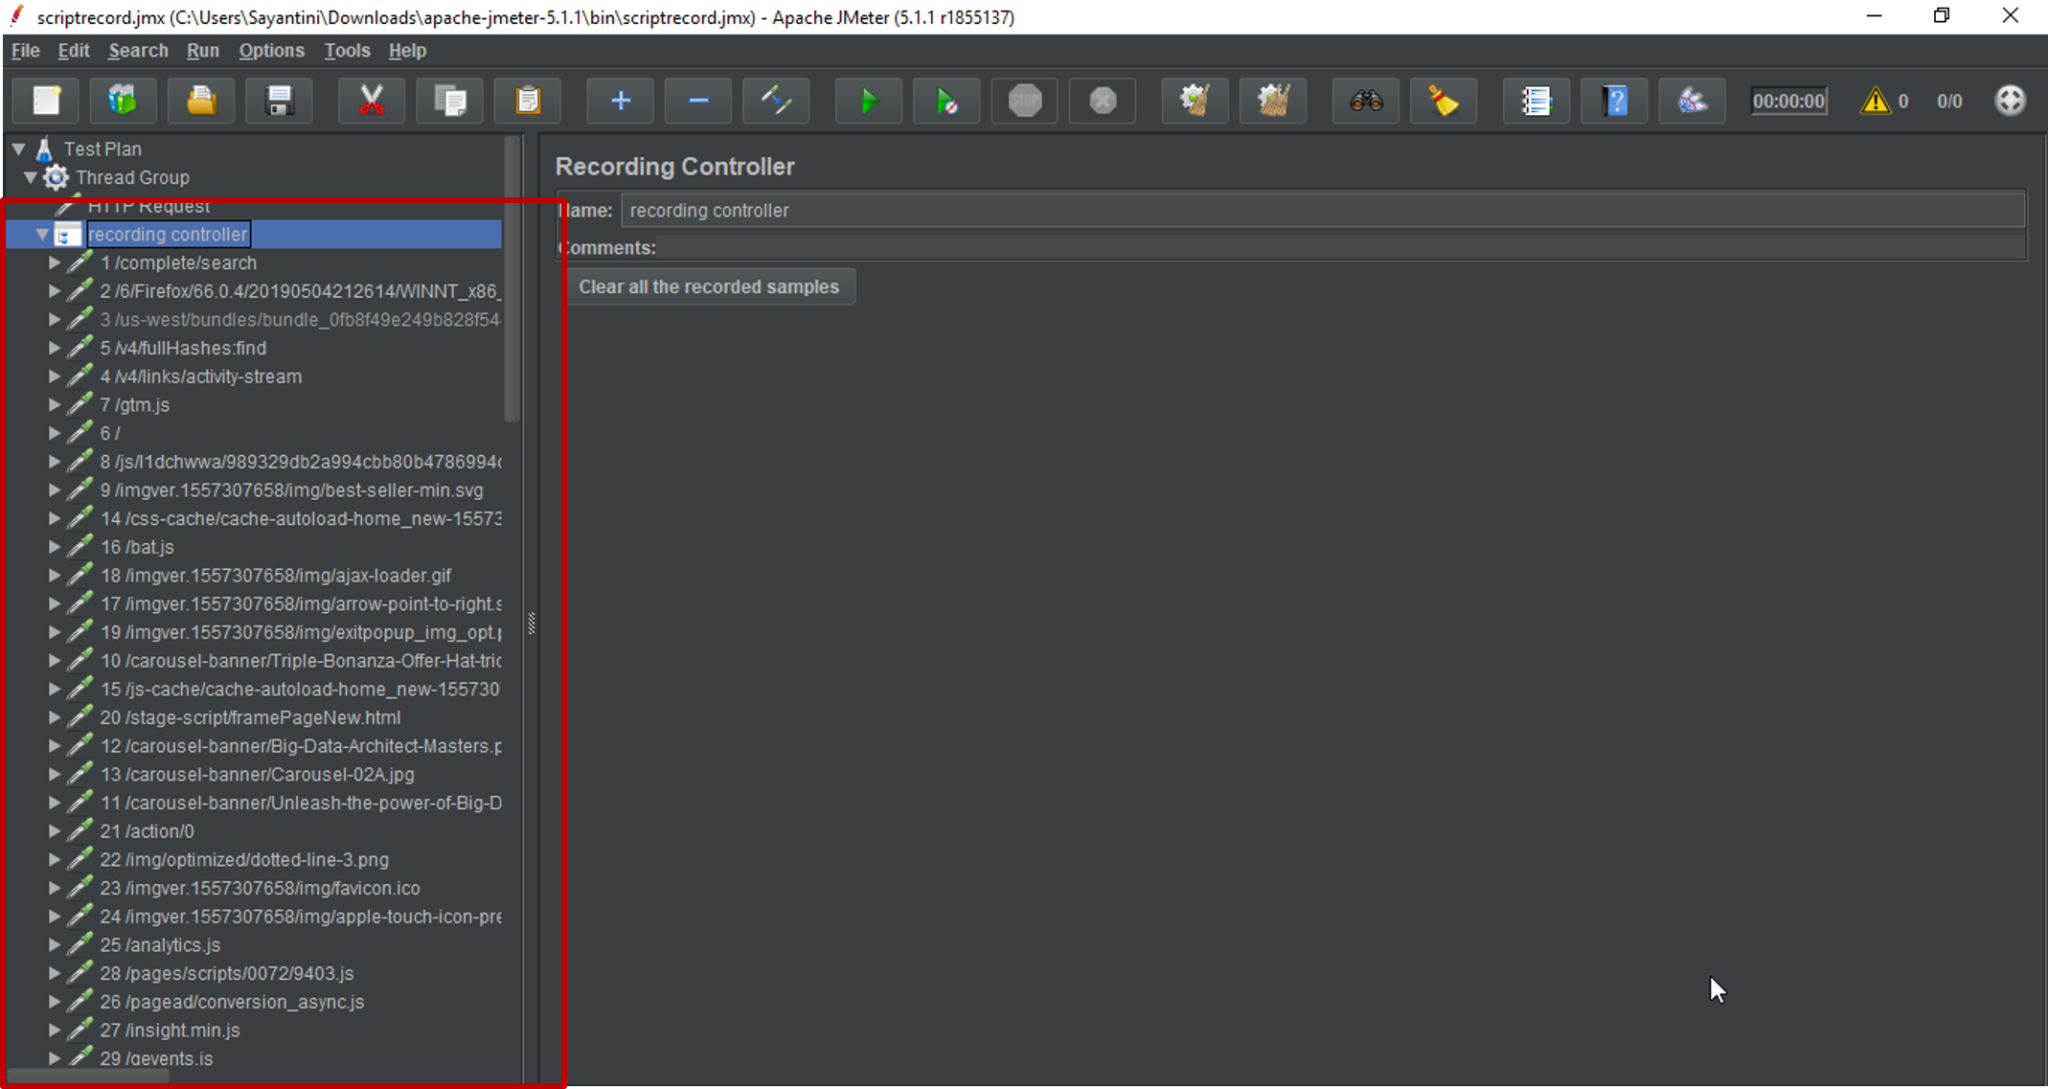
Рядом с Recording Controller должен появиться маленький символ треугольника. Чтобы получит расширенные сведения, кликните по нему. На экране появится список HTTP-запросов, составленный согласно установленному шаблону.
Этот список можно отредактировать вручную, просто удалив ненужные запросы.
Если Recording Controller не предоставил списка запросов, просмотрите шаблоны для HTTP(S) Test Script Recorder.
Примечание: Рекомендуется удалить все шаблоны.
Завершив запись запросов, нажмите Stop в окне HTTP(S) Test Script Recorder.
Имейте в виду: на данный момент браузер Firefox не имеет доступа к другим страницам, поскольку он настроен для использования порта 8080 в качестве прокси. Чтобы изменить это поведение, настройте браузер для использования «No proxy».
Запуск тестирования
Когда план тестирования будет готов, сохраните и запустите его. Он будет работать в точности как созданный вручную тест; вы можете настраивать, удалять, добавлять в него компоненты.
Заключение
HTTP(S) Test Script Recorder поможет быстро разработать план JMeter.
Инструмент JMeter позволяет оптимизировать и усовершенствовать сервер веб-приложения, устранить неполадки в настройках и увеличить его производительность.
Данное руководство охватывает только основы работы с Recording Controller. Изучите остальные функции этого инструмента самостоятельно.
Tags: Apache, Apache JMeter, Oracle Java 7
Last updated on Jul 13,2020 4.1K Views
A Data Science Enthusiast with in-hand skills in programming languages such as… A Data Science Enthusiast with in-hand skills in programming languages such as Java & Python.
The Software Development process is becoming complex each day. Thus, The software testing methods need to evolve to keep up with the development approaches. In this JMeter Script Recording article, we will learn how to record browser interactions in JMeter in the following sequence:
- What is Script Recording?
- Prerequisites
- Steps to Record a Script
- JMeter Script Recording: Demo
What is Script Recording?
Record Testing is a method of script recording that helps the tester to run their activity against the test target. JMeter is one of the most preferred tools for software testing approaches. The Test Script Recorder in JMeter is designed to record such scenarios. So, your JMeter works like a proxy with the help of the HTTP(S) Test Script Recorder.

A Proxy is a component which inserts between you and the remote server. It is similar to a man-in-the-middle attack but in this case, you are spying on yourself. So you can record browser interactions when your JMeter starts acting like a proxy. It is one of the advanced approaches in software testing to eliminate the complexity of browser interactions.
Prerequisites
You need to be well versed with the working of JMeter before you start the process of script recording. If you have any doubts regarding this tool, you can check out the JMeter Tutorial for more knowledge. The software requirements for JMeter Script recording include:
- Apache JMeter
- Java 6 or later versions
- Mozilla Firefox
These are some of the prerequisites for script recording in JMeter. Now let’s move ahead and have a look at the different steps involved in the process of recording browser interactions.
Steps to Record a Script
There are certain basic steps involved in the process of script recording. While using JMeter, you have to perform a number of tasks to obtain browser interactions. The steps required for recording a script are:
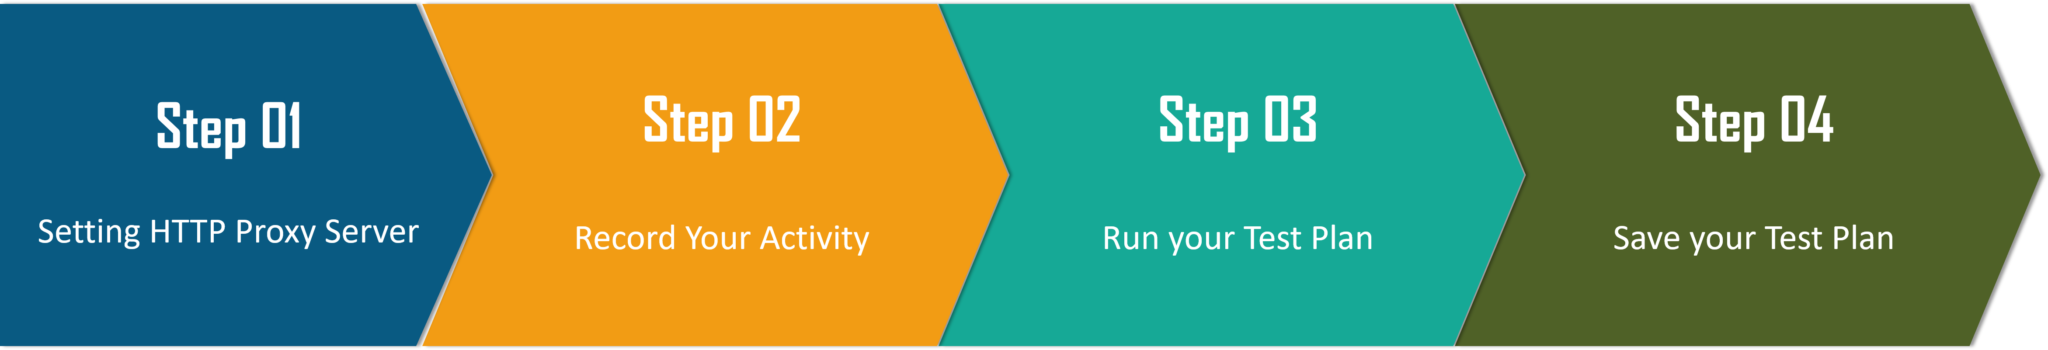
- Setting HTPP Proxy Server
- Record your Activity
- Run your Test Plan
- Save your Test Result
JMeter helps you record a script without much hassle and in a simpler manner. So, let’s move ahead and see how to record a script in JMeter with an example.
JMeter Script Recording: Demo
- Firstly, you have to start your JMeter and select the Test Plan.
- Next, Right click on the Test Plan and add a Thread Group.
- Then you have to add HTTP Request and enter the Server name or IP of the website for which you are recording the script. Right click on Thread Group, select Sampler and add HTTP Request.
- After adding HTTP Request, you have to add a Recording Controller. Right click on Thread Group, select Logic Controller and add Recording Controller.
- Next, you have to add HTTP(S) Test Script Recorder. This helps the JMeter to act as a proxy. Right click on the Test Plan, select Non-Test Elements and add HTTP(S) Test Script Recorder.
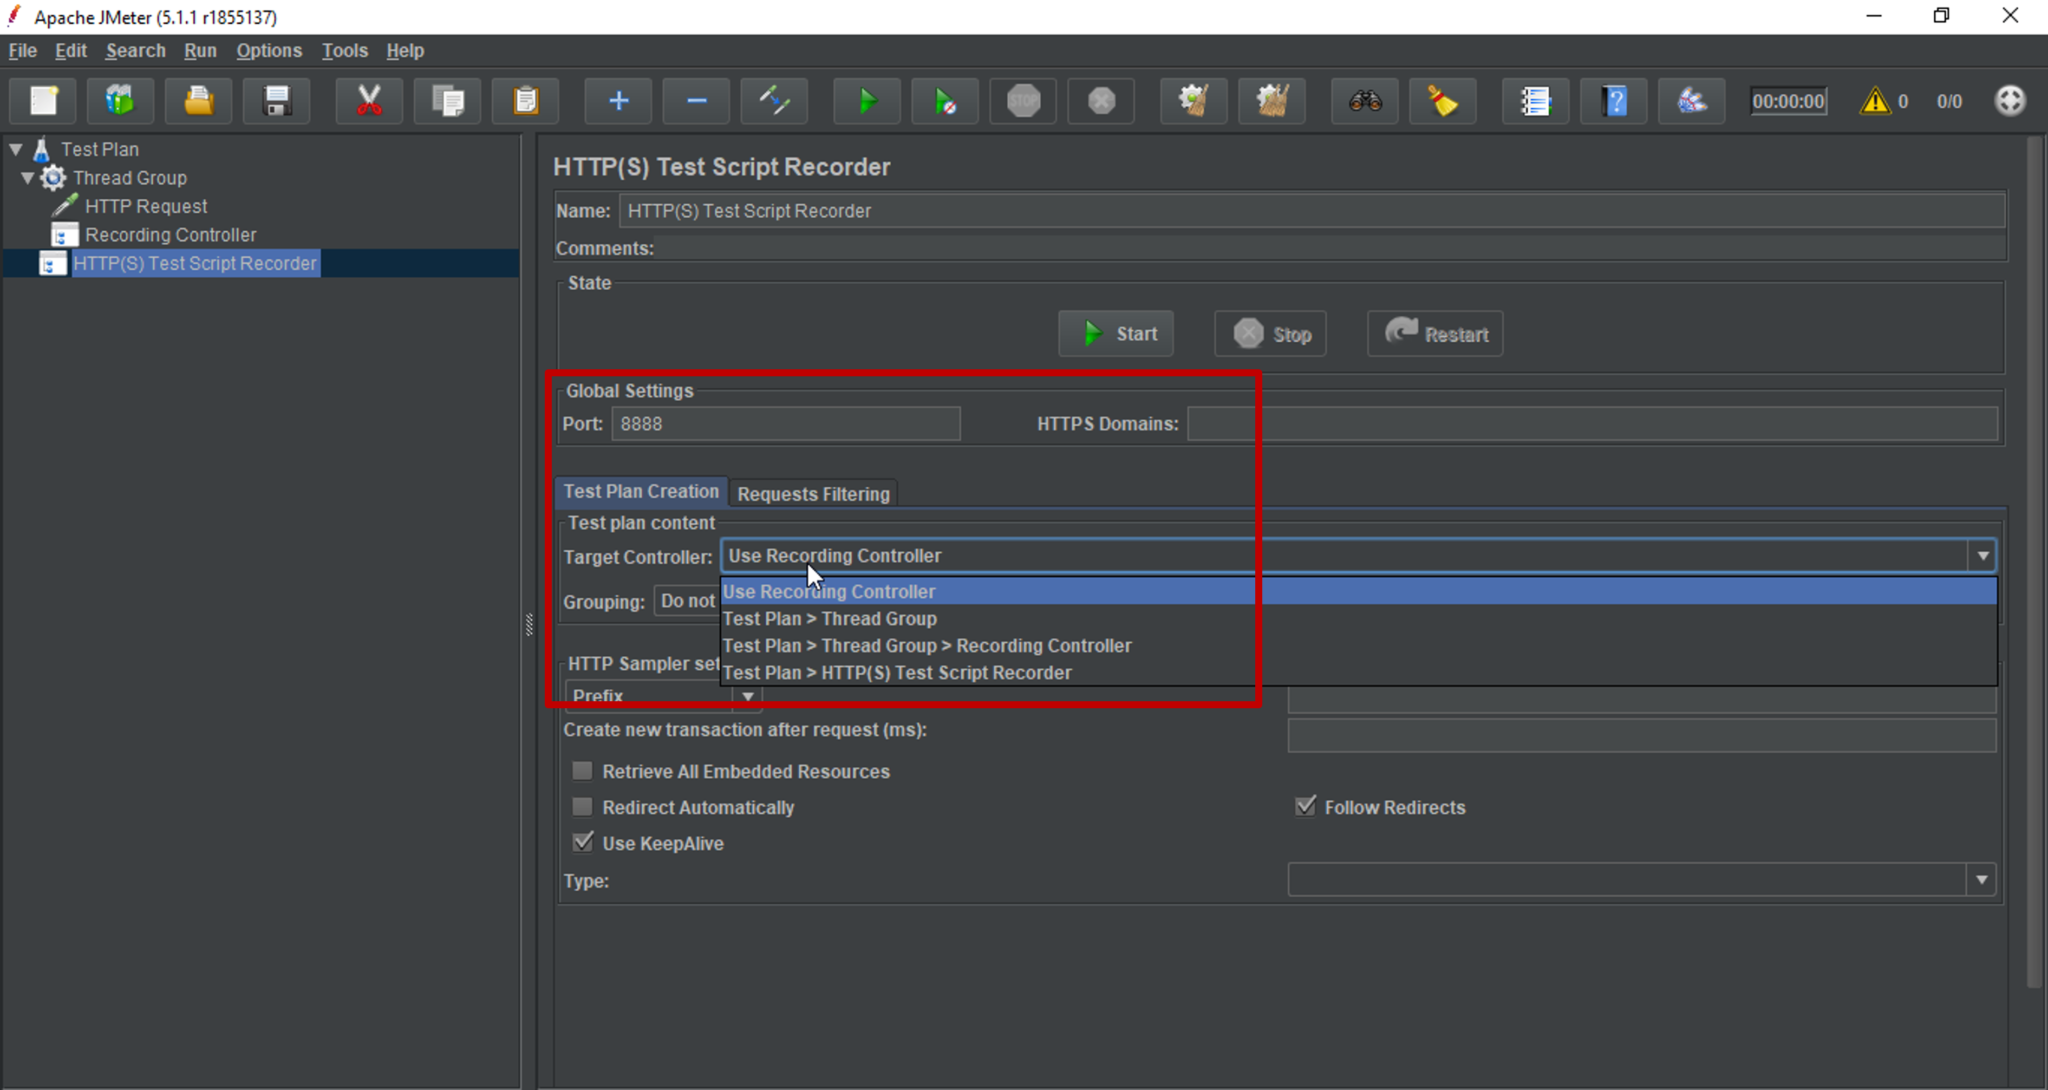
- After adding the Proxy Server, you have to set the Port Number and the Target Controller on which you want to record the script. Once the target controller is set, you can click on the Start button and begin the JMeter proxy server.
- Before recording the activity of your website, open Firefox web browser and change the proxy settings. Click on Network Settings, select Manual Proxy Configuration and set the port number the same as the one in HTTP(S) Test Script Recorder.
- Now go to the Firefox web browser and open the website as specified in HTTP Request. Once the page has been loaded, you can open JMeter and check the events under Recording Controller.
- All the events that took place while loading the website have been recorded as a script in JMeter.
These are the steps you need to follow in the process of Script Recording in JMeter. With this, we have come to the end of this article. I hope you understood how you can use JMeter as a proxy server to record browser interactions.
Now that you know how to Record Scripts in JMeter, check out the Performance Testing Using JMeter Course by Edureka. This course provides you insights into software behavior during workload. In this course, you will learn how to check the response time and latency of software and test if a software package is efficient for scaling. It will help you check the strength and analyze the overall performance of an application under different load types.
Got a question for us? Please mention it in the comments section of “JMeter Script Recording” and we will get back to you.
Upcoming Batches For Performance Testing Using JMeter
| Course Name | Date | |
|---|---|---|
| Performance Testing Using JMeter |
Class Starts on 18th February,2023 18th February SAT&SUN (Weekend Batch) |
View Details |
Recommended videos for you

Automate Web Apps Testing With Selenium Webdriver
Watch Now

Selenium Tutorial – A Complete Tutorial on Selenium Automation Testing
Watch Now

Selenium WebDriver Tutorial – Get Started With Selenium WebDriver
Watch Now

Test Automation With Selenium Webdriver
Watch Now

Selenium IDE Tutorial – Get Started With Selenium IDE
Watch Now

Top 30 Selenium Interview Questions And Answers
Watch Now

Automated Testing Using Selenium Webdriver
Watch Now

Quality Assurance With Manual Testing
Watch Now

Selenium Grid Tutorial – Get Started With Selenium Grid
Watch Now

Why Use Selenium with $3 Million Bugs?
Watch Now
Recommended blogs for you

Performance Testing Tutorial – What is it & its Types?
Read Article

Selenium Tutorial: All You Need To Know About Selenium WebDriver
Read Article

Everything you need to know about the Listeners in Selenium
Read Article

How to Select a value from a drop-down in Selenium WebDriver
Read Article

Know How To Perform Cross Browser Testing Using LambdaTest
Read Article

Setting up a Selenium Grid for distributed Selenium testing
Read Article

Smoke Testing and Sanity Testing: How are they different?
Read Article

All you need to know about WebElement in Selenium
Read Article

Selenium Career Opportunities: Why You Should Master Selenium WebDriver
Read Article

What is Selenium? Getting started with Selenium Automation Testing
Read Article

Top Selenium Interview Questions For Beginners In 2023
Read Article

All you need to know about Robot Class in Selenium WebDriver
Read Article

What is setProperty in Selenium and how can it be used?
Read Article

How to Write a Good Test Plan in Software Testing?
Read Article

What are the Challenges and Limitations of Selenium?
Read Article

Software Testing Tools : All You Need To Know About Top Testing Tools
Read Article

New Features of ChroPath for XPath and CSS Selectors
Read Article
Last updated on Jul 13,2020 4.1K Views
A Data Science Enthusiast with in-hand skills in programming languages such as… A Data Science Enthusiast with in-hand skills in programming languages such as Java & Python.
The Software Development process is becoming complex each day. Thus, The software testing methods need to evolve to keep up with the development approaches. In this JMeter Script Recording article, we will learn how to record browser interactions in JMeter in the following sequence:
- What is Script Recording?
- Prerequisites
- Steps to Record a Script
- JMeter Script Recording: Demo
What is Script Recording?
Record Testing is a method of script recording that helps the tester to run their activity against the test target. JMeter is one of the most preferred tools for software testing approaches. The Test Script Recorder in JMeter is designed to record such scenarios. So, your JMeter works like a proxy with the help of the HTTP(S) Test Script Recorder.
A Proxy is a component which inserts between you and the remote server. It is similar to a man-in-the-middle attack but in this case, you are spying on yourself. So you can record browser interactions when your JMeter starts acting like a proxy. It is one of the advanced approaches in software testing to eliminate the complexity of browser interactions.
Prerequisites
You need to be well versed with the working of JMeter before you start the process of script recording. If you have any doubts regarding this tool, you can check out the JMeter Tutorial for more knowledge. The software requirements for JMeter Script recording include:
- Apache JMeter
- Java 6 or later versions
- Mozilla Firefox
These are some of the prerequisites for script recording in JMeter. Now let’s move ahead and have a look at the different steps involved in the process of recording browser interactions.
Steps to Record a Script
There are certain basic steps involved in the process of script recording. While using JMeter, you have to perform a number of tasks to obtain browser interactions. The steps required for recording a script are:
- Setting HTPP Proxy Server
- Record your Activity
- Run your Test Plan
- Save your Test Result
JMeter helps you record a script without much hassle and in a simpler manner. So, let’s move ahead and see how to record a script in JMeter with an example.
JMeter Script Recording: Demo
- Firstly, you have to start your JMeter and select the Test Plan.
- Next, Right click on the Test Plan and add a Thread Group.
- Then you have to add HTTP Request and enter the Server name or IP of the website for which you are recording the script. Right click on Thread Group, select Sampler and add HTTP Request.
- After adding HTTP Request, you have to add a Recording Controller. Right click on Thread Group, select Logic Controller and add Recording Controller.
- Next, you have to add HTTP(S) Test Script Recorder. This helps the JMeter to act as a proxy. Right click on the Test Plan, select Non-Test Elements and add HTTP(S) Test Script Recorder.
- After adding the Proxy Server, you have to set the Port Number and the Target Controller on which you want to record the script. Once the target controller is set, you can click on the Start button and begin the JMeter proxy server.
- Before recording the activity of your website, open Firefox web browser and change the proxy settings. Click on Network Settings, select Manual Proxy Configuration and set the port number the same as the one in HTTP(S) Test Script Recorder.
- Now go to the Firefox web browser and open the website as specified in HTTP Request. Once the page has been loaded, you can open JMeter and check the events under Recording Controller.
- All the events that took place while loading the website have been recorded as a script in JMeter.
These are the steps you need to follow in the process of Script Recording in JMeter. With this, we have come to the end of this article. I hope you understood how you can use JMeter as a proxy server to record browser interactions.
Now that you know how to Record Scripts in JMeter, check out the Performance Testing Using JMeter Course by Edureka. This course provides you insights into software behavior during workload. In this course, you will learn how to check the response time and latency of software and test if a software package is efficient for scaling. It will help you check the strength and analyze the overall performance of an application under different load types.
Got a question for us? Please mention it in the comments section of “JMeter Script Recording” and we will get back to you.
Upcoming Batches For Performance Testing Using JMeter
| Course Name | Date | |
|---|---|---|
| Performance Testing Using JMeter |
Class Starts on 18th February,2023 18th February SAT&SUN (Weekend Batch) |
View Details |
Recommended videos for you
Selenium WebDriver Tutorial – Get Started With Selenium WebDriver
Watch Now
Automated Testing Using Selenium Webdriver
Watch Now
Selenium IDE Tutorial – Get Started With Selenium IDE
Watch Now
Quality Assurance With Manual Testing
Watch Now
Selenium Grid Tutorial – Get Started With Selenium Grid
Watch Now
Why Use Selenium with $3 Million Bugs?
Watch Now
Top 30 Selenium Interview Questions And Answers
Watch Now
Automate Web Apps Testing With Selenium Webdriver
Watch Now
Selenium Tutorial – A Complete Tutorial on Selenium Automation Testing
Watch Now
Test Automation With Selenium Webdriver
Watch Now
Recommended blogs for you

How to Get Started with XPath in Selenium – XPath Tutorial
Read Article

Regression Testing Complete Guide: Everything You Need To Know
Read Article
Performance Testing Tutorial – What is it & its Types?
Read Article

What are the various Components of Selenium Suite?
Read Article
What are the Challenges and Limitations of Selenium?
Read Article

Exceptions in Selenium – Know How To Handle Exceptions
Read Article
What is Selenium? Getting started with Selenium Automation Testing
Read Article

Top 50 Selenium Interview Questions And Answers You Must Prepare In 2023
Read Article

Everything that you need to know about software testing methodologies and techniques
Read Article
Selenium Career Opportunities: Why You Should Master Selenium WebDriver
Read Article
New Features of ChroPath for XPath and CSS Selectors
Read Article

Everything You Need to Know About Waits in Selenium
Read Article

Learn How To Build and Execute Selenium Projects
Read Article
Software Testing Tools : All You Need To Know About Top Testing Tools
Read Article
| Введение | |
| Подготовка плана | |
| Настройка прокси в браузере | |
| Импорт сертификата | |
| Запись | |
| Похожие статьи |
Введение
В этой статье Вы можете узнать о том как с помощью JMeter GUI и браузера Firefox можно записать тест.
Добавлено минимум элементов, чтобы сосредоточить внимание именно на записи. В дальнейшем нужно будет
использовать больше элементов и организовать запись немного сложнее.
Подготовка плана
Пустой план выглядит следующим оригинальным образом:

Будем добавлять самые необходимые элементы вручную по одному
Вместо добавления элементов вручную можно воспользоваться шаблоном Recording
Как обычно нужно кликнуть на план правой кнопкой мыши и выбрать
Add → Threads (Users) → Thread Groups
Под планом появится Thread Group с иконкой в виде шестерёнки.
Для записи теста нужно добавить HTTP(S) Test Script Recorder
Правый клик на план → Add → Non-Test Elements → HTTP(S) Test Script Recorder

Настройки HTTP(S) Test Script Recorder выглядят следующим оригинальным образом:

Обратите внимание на Port. На нём JMeter будет просматривать трафик. Поменяем его на 8877 исключительно для наглядности и
запомним значение.

На этом предварительная настройка плана закончена. Следующий шаг — настроить браузер, чтобы он использовал порт 8877 в качестве прокси.
Настройка браузера
Скачайте и установите
Firefox
о том где это можно сделать читайте
здесь
.
Другие браузеры не позволяют настроить прокси только для себя.
Отройте
Firefox
. В правом верхнем углу нажмите на иконку меню и выберите Options. Либо сразу нажмите на значок в виже шестерёнки.

Прокрутите вниз до Network Settings и нажмите Settings…

Выберите Manual proxy configuration поменяйте порт на 8877
отметьте Also use this proxy for FTP and HTTPS
(Также может встретиться вариант «Use this proxy for all protocols»)

Проверьте, чтобы в поле No Proxy for не было ничего лишнего. Если Вы видите это поле впервые — можете просто
очистить.

Если вы планируете тестировать на локальном хосте — прочитайте статью
«Прокси для localhost»
если тестировать будете на другом компьютере или через интернет — продолжайте читать эту статью.
Сертификат
Для работы в браузере нужен сертификат. О том как его получить и использовать вы узнаете в этом параграфе.
Вернёмся в JMeter и в HTTP(S) Test Script Recorder
изменим
Target Controller
на
Test Plan > HTTP(S) Test Script Recorder


Теперь план окончательно подготовлен к записи. Обратите внимание на содержимое папки apache-jmeter-X.Xbin

Никаких сертификатов там пока нет.
Возвращайтесь в JMeter и нажмите Start

Появится сообщение о создании сертификата. Нажмите OK

Появится новое окно

Обратите внимание на содержимое папки apache-jmeter-X.Xbin

Сертификаты появились.
Вернитесь в настройки Firefox. В поиске наберите certificates. Нажмите
View Certificates

Нажмите Import

Выберите сертификат

Закройте браузер и остановите запись нажав Stop убедитесь что
это
окно закрылось.
Запись
В JMeter нажмите Start и OK в окне про сертификат.
Отройте
Firefox
Зайдите на любой сайт, например на
https://www.heihei.ru/fly/

Введите город назначения, например,
Малага
и нажмите «Найти билеты». Обратите внимание на то, сколько времени занимает поиск.


В JMeter нажмите на Stop и затем на треугольник у HTTP(S) Test Script Recorder

Развернётся дерево всех записанных действий

Тест записан. О том как его обработать вы можете прочитать в
следующей статье
«Обработка записанного теста»
| JMeter | |
| Установка в Windows | |
| Запись теста | |
| Тестирование ПО | |
| Где учиться на тестировщика | |
| Учебник по тестированию API | |
| Тестирование API | |
| Автоматизация тестирования | |
| Selenium | |
| Playwright | |
| SOAP UI | |
| JUnit | |
| Java |